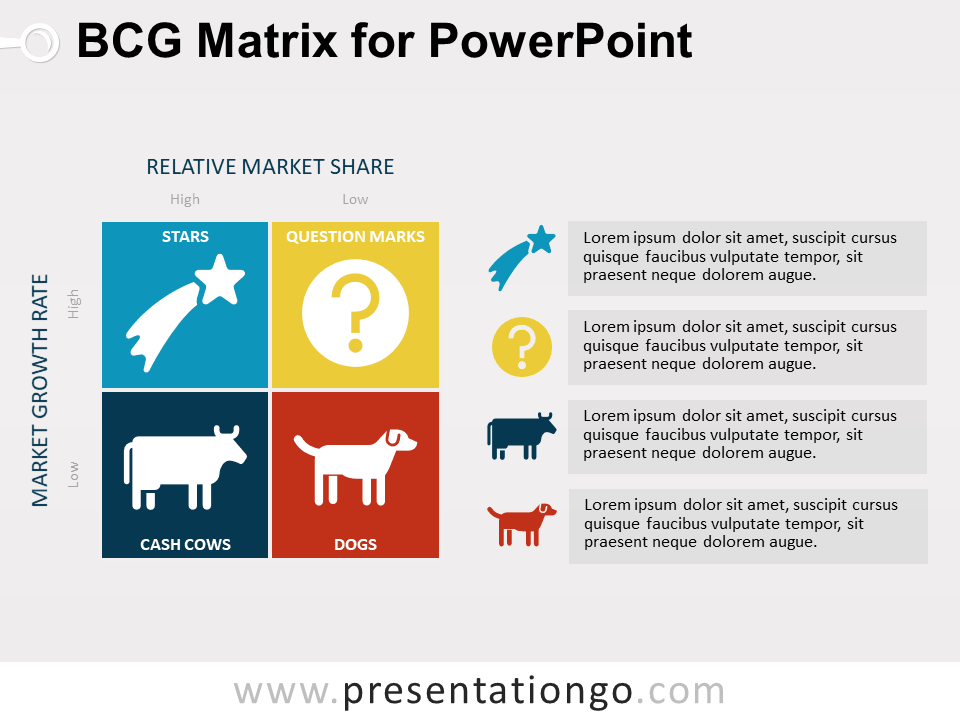
Free BCG matrix diagram for PowerPoint. Colored graphic design with 4 quadrants (2×2 cells) and icons. Editable graphics with text placeholder.
BCG Matrix
The growth–share matrix (aka the product portfolio matrix, Boston Box, BCG-matrix, Boston matrix, Boston Consulting Group analysis, portfolio diagram) is a chart that was created by Bruce D. Henderson for the Boston Consulting Group in 1970 to help corporations to analyze their business units, that is, their product lines. This helps the company allocate resources and is used as an analytical tool in brand marketing, product management, strategic management, and portfolio analysis. Some analysis of market performance by firms using its principles has called its usefulness into question.
— Source: Wikipedia
Shapes are 100% editable: colors and sizes can be easily changed.
Includes 2 slide option designs: Standard (4:3) and Widescreen (16:9).
Widescreen (16:9) size preview:


This ‘BCG Matrix for PowerPoint’ features:
- 2 unique slides
- Light and Dark layout
- Ready to use template with text placeholder
- Completely editable shapes
- Uses a selection of editable PowerPoint icons
- Standard (4:3) and Widescreen (16:9) aspect ratios
- PPTX file
Free fonts used:
- Helvetica (System Font)
- Calibri (System Font)


Comments are closed.