Free battery chart for PowerPoint and Google Slides. Design of a fragmented battery. Each part represents a fraction of a numerical value. Easy-to-customize editable graphics with numbers, icons, and text placeholders.
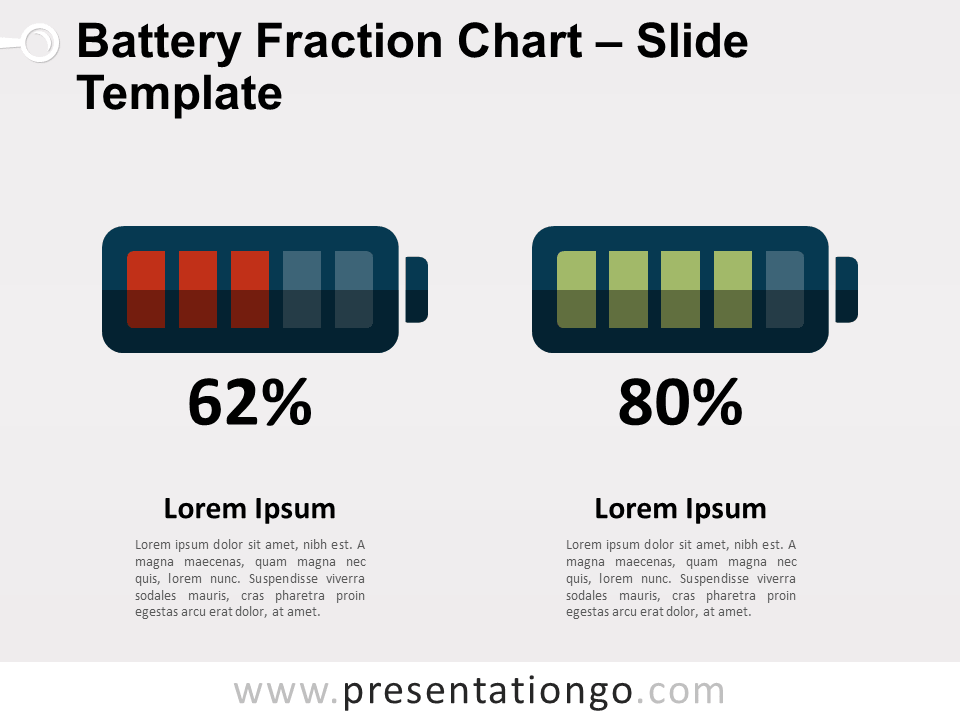
Battery Chart
This non-data-driven chart uses a popular symbol for data visualization: the battery symbol. As a matter of fact, most people know how it works since the battery icon is present in most digital devices. As a result, the battery is a symbol that is very easy to understand when combined to quantitative data.
More specifically, this infographic illustration shows a battery with 2 to 6 fractions. And the length of each bar is proportionate to the numerical value or percentage that it represents.
You can use it to illustrate quantitative results, to show percentages, completion results, or progress.
Shapes are 100% editable: colors and sizes can be easily changed. And obviously, you can adapt the number of bars as you wish.
Includes 2 slide option designs: Standard (4:3) and Widescreen (16:9).
Widescreen (16:9) size preview:


This ‘Battery Chart for PowerPoint and Google Slides’ features:
- 2 unique slides
- Light and Dark layout
- Ready to use template with numbers, icons, and text placeholders
- Completely editable shapes
- Uses a selection of editable PowerPoint icons
- Standard (4:3) and Widescreen (16:9) aspect ratios
- PPTX file and for Google Slides
Free fonts used:
- Helvetica (System Font)
- Calibri (System Font)