Free infographic arc charts for PowerPoint and Google Slides. Two side-by-side stylish single circular gauge charts designed with adjustable arc shapes. Editable graphics.
Infographic Arc Charts
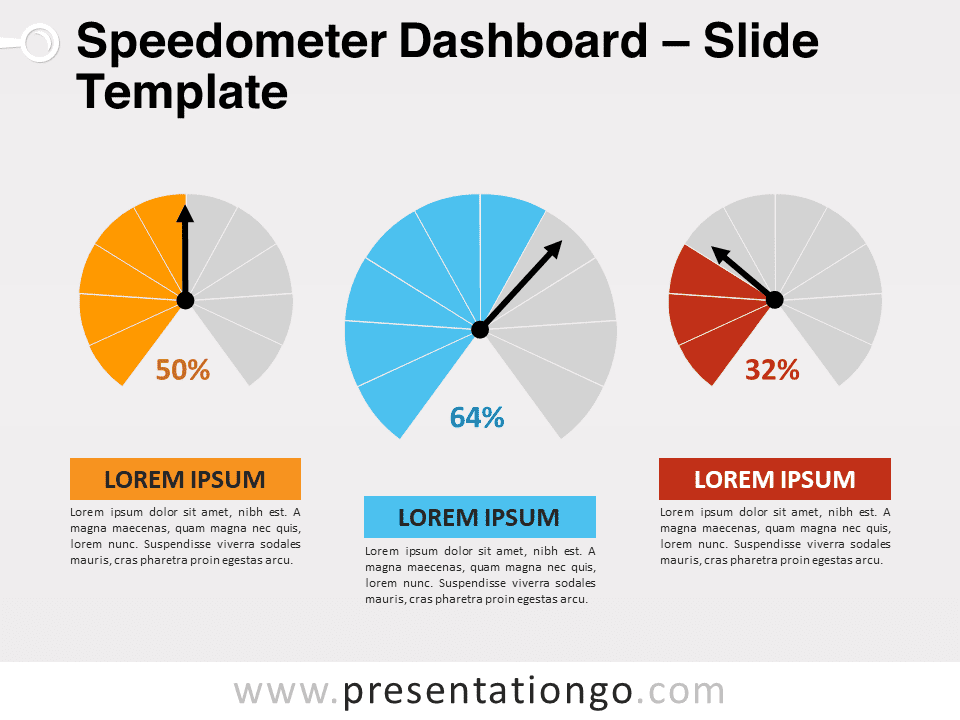
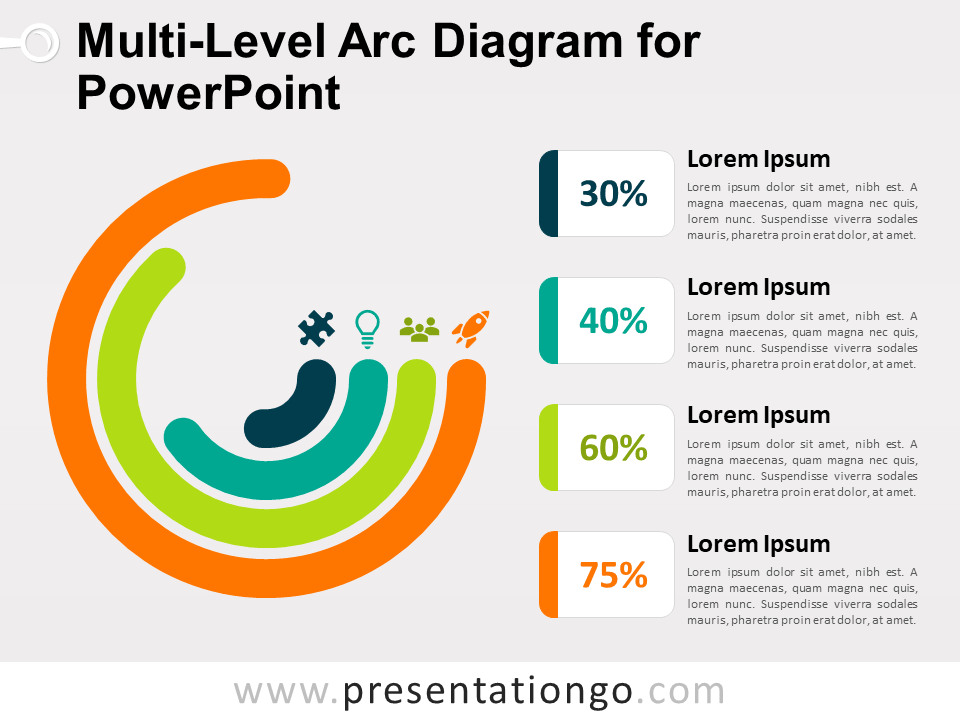
A circular gauge chart looks like a circular bar chart. This type of chart is commonly used in data visualization infographics. Indeed, circular gauge charts provide at a glance easy data reading.
More specifically, this infographic template slide showcases two charts. Since they are displayed side-by-side, the comparison of results is very easy to visualize. Also, each gauge chart has a blank area in the middle to display the value of the series. Another alternative is to insert a custom icon in this middle cutout. The choice is yours!
Finally, a gray full ring stands right between the 2 charts. In this circle shape, you can use another custom icon.
Usage instructions:
To adapt the length of the circular bar, just click, hold, drag, and release

Shapes are 100% editable: colors and sizes can be easily changed.
Includes 2 slide option designs: Standard (4:3) and Widescreen (16:9).
Widescreen (16:9) size preview:


This ‘Infographic Arc Charts for PowerPoint and Google Slides’ features:
- 2 unique slides
- Light and Dark layout
- Ready to use template with icons and text placeholders
- Completely editable shapes
- Uses a selection of editable PowerPoint icons
- Standard (4:3) and Widescreen (16:9) aspect ratios
- PPTX file and for Google Slides
Free fonts used:
- Helvetica (System Font)
- Calibri (System Font)