Skip to content
PresentationGO
  • Explore
    • Templates
      • Abstract
      • Sports
      • Business
      • Religion & Holidays
      • Nature
      • Technology
      • Professions
      • Flat Lays & Scenes
      • Health & Recreation
      • Color Palettes
      • Education
      • Food & Drink
      • Science
      • CertificatesNEW
      • All Templates
    • Charts & Diagrams
      • Processes
        • Circular
        • Linear
        • Alternating
        • Stairs
        • Bending
      • Funnels
      • Pyramids
      • Matrix Charts
      • Business Models
      • Non-Data-Driven Chart Alternatives
      • Radial Diagrams
      • Flow Charts
      • Data-Driven Charts & Graphs
      • Organizational Charts
      • Clusters & Relationships
      • Venn Diagrams
      • All Charts & Diagrams
    • Text & Tables
      • Text Boxes
      • Comparisons
      • Paper & Banners
      • Numbered Lists
      • Speaking Bubbles
      • Pricing Tables
      • Bullet Point / Text Layouts
      • Contents & Table of Contents
      • Quotes
      • Word Clouds
      • To-do & Checklists
      • All Text & Tables
    • Timelines & Planning
      • Calendars
      • Timelines
      • Gantt Charts
      • Agenda
      • All Timelines & Planning
    • Graphics & Metaphors
      • Concepts
      • Silhouettes & People
      • Light Bulbs
      • Trees
      • Letters & Numbers
      • Signs
      • Mockups
      • Food
      • Money
      • Road
      • Target and Goals
      • All Graphics & Metaphors
    • Maps & Flags
      • Flag Templates
      • Continent Maps
      • Country Maps
        • Africa
        • Asia
        • Australia / Oceania
        • Europe
        • North America
        • South America
      • World Maps
      • All Maps
    • AI ImagesNEW
  • Search by
    • Colors
      • Black
      • Blue
      • Brown
      • Gray
      • Green
      • Cream
      • Light Blue
      • Orange
      • Pink
      • Purple
      • Gold
      • Red
      • White
      • Yellow
      • Teal
    • Steps (Options)
      • 2 options
      • 3 options
      • 4 options
      • 5 options
      • 6 options
      • 7 options
      • 8 options
      • 9 options
      • 10 options
      • 12 options
  • Templates
  • Charts & Diagrams
  • Text & Tables
  • Timelines & Planning
  • Graphics & Metaphors
  • Maps & Flags
  • AI ImagesNEW
Charts & Diagrams > Processes

Processes

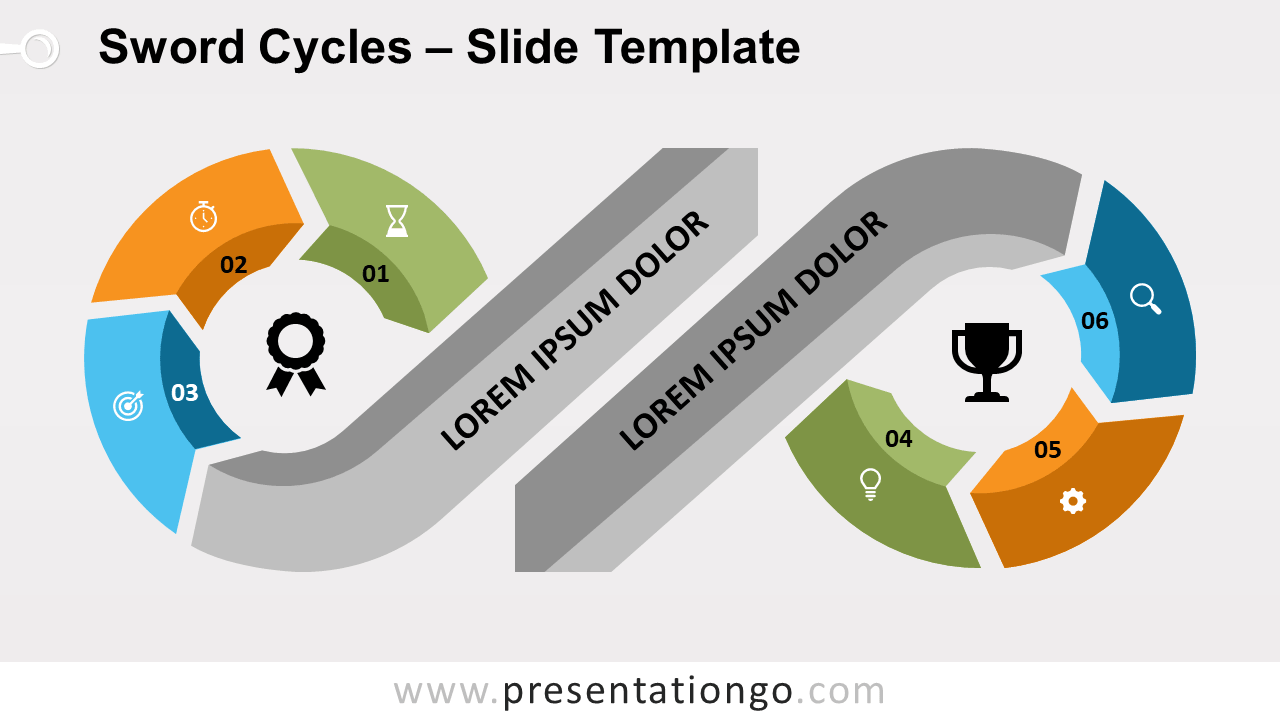
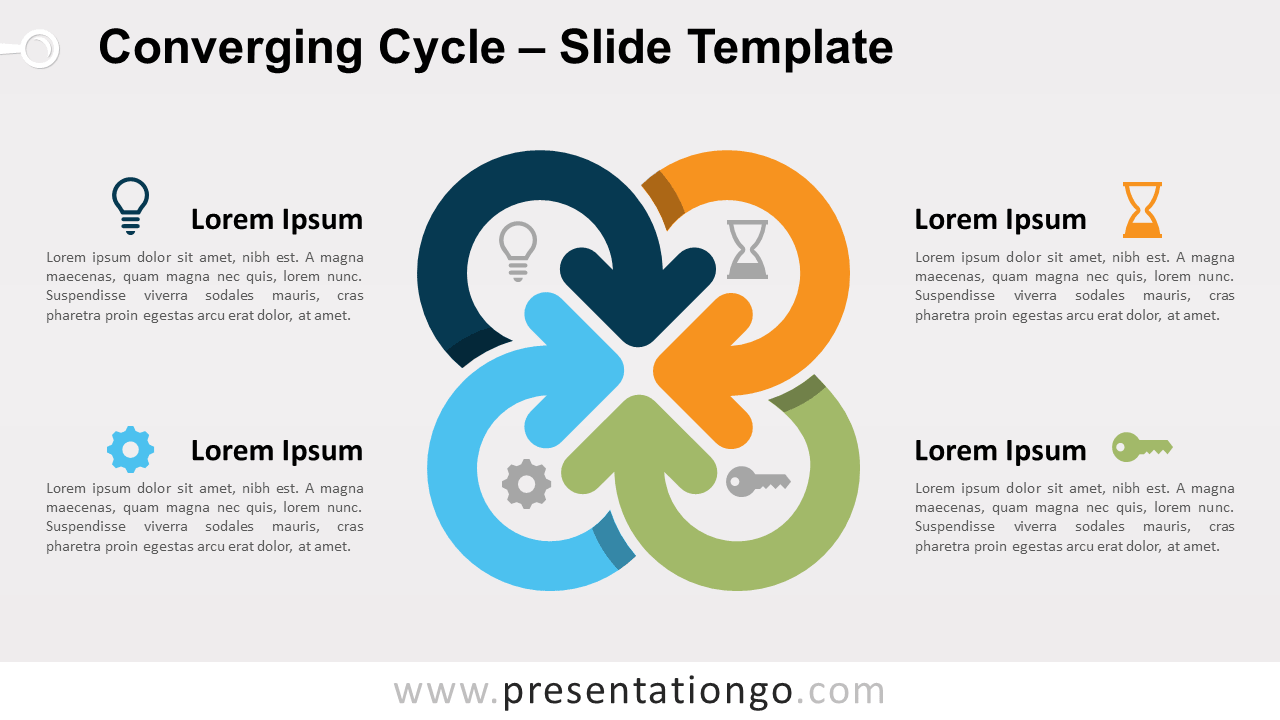
Simplify complex workflows and wow your audience with our 987 free Process diagrams for PowerPoint and Google Slides. Choose from linear, circular, alternating, stairs, and bending workflows to visually explain any process with clarity and impact.

Main Processes Categories:CircularLinearAlternatingStairsBending
Free Satellite Arrows for PowerPoint and Google Slides
Charts & Diagrams
3 options

Satellite Arrows for PowerPoint and Google Slides

Illustration of a continued circular path made with 3 curved arrows (like satellite orbits).

Google Slides, PPTX

4:316:9

Free Sword Cycles for PowerPoint and Google Slides
Charts & Diagrams
3 options6 options

Sword Cycles for PowerPoint and Google Slides

Illustration of two 3-step circular diagrams ending with a sword. The 2 diagrams together make an infinity symbol.

Google Slides, PPTX

4:316:9

Free Cycle Matrix Infographic for PowerPoint and Google Slides
Charts & Diagrams
4 options

Cycle Matrix Infographic for PowerPoint and Google Slides

4-step circular diagram with curved arrows and speech bubbles.

Google Slides, PPTX

4:316:9

Free 6-Step Puzzle Cycle for PowerPoint and Google Slides
Charts & Diagrams
6 options

6-Step Puzzle Cycle for PowerPoint and Google Slides

Donut-like hexagonal shape with 6 puzzle pieces, assembled or interlocked in a circular flow.

Google Slides, PPTX

4:316:9

Free 4-Step Twisted Cycle for PowerPoint and Google Slides
Charts & Diagrams
4 options

4-Step Twisted Cycle for PowerPoint and Google Slides

Free cycle diagram with 4 twisted shapes for PowerPoint and Google Slides. 4-step circular diagram.

Google Slides, PPTX

4:316:9

Free 3-Step Twisted Cycle for PowerPoint and Google Slides
Charts & Diagrams
3 options

3-Step Twisted Cycle for PowerPoint and Google Slides

Free cycle diagram with 3 twisted shapes for PowerPoint and Google Slides. 3-step circular diagram.

Google Slides, PPTX

4:316:9

Free Converging Cycle for PowerPoint and Google Slides
Charts & Diagrams
4 options

Converging Cycle for PowerPoint and Google Slides

4 curved arrows converging to a circular shape in the center. Great slide to illustrate the relationship to a central idea.

Google Slides, PPTX

4:316:9

Free Recycling Diagram for PowerPoint and Google Slides
Charts & DiagramsGraphics & Metaphors
3 options

Recycling Diagram for PowerPoint and Google Slides

Colorful illustration of the universal recycling symbol.

Google Slides, PPTX

4:316:9

Free Shell Diagram for PowerPoint and Google Slides
Charts & Diagrams
5 options

Shell Diagram for PowerPoint and Google Slides

An editable scallop shell used as a semi-circular cycle diagram, with 5 colorful stages.

Google Slides, PPTX

4:316:9

Free Teardrop Process Diagram for PowerPoint and Google Slides
Charts & Diagrams
5 options

Teardrop Process Diagram for PowerPoint and Google Slides

Free teardrop process diagram for PowerPoint and Google Slides. Horizontal process diagram with five (5) right teardrop shapes.

Google Slides, PPTX

4:316:9

Free Infographic Continuous Process for PowerPoint and Google Slides
Charts & Diagrams
6 options

Infographic Continuous Process for PowerPoint and Google Slides

Horizontal process diagram with six (6) up and down curved daggerboard (or like a fin) shapes.

Google Slides, PPTX

4:316:9

Converging Radial Diagram for PowerPoint and Google Slides
Charts & Diagrams
6 options

Converging Radial Diagram for PowerPoint and Google Slides

Cycle chart with 6 circles and arrows converging to a hexagonal shape in the center.

Google Slides, PPTX

4:316:9

Older posts
Newer posts
← Previous Page1 … Page64 Page65 Page66 … Page83 Next →
Search Templates by categories
Templates Charts & Diagrams Text & Tables Maps & Flags Timelines & Planning Graphics & Metaphors
Search Templates by colors
Support us
icon of a coffee cup for 'support us' - PresentationGo
... buying us a coffee

Love our templates? Show your support with a coffee!

Donate Here

Thank you for fueling our creativity!

Logotype PresentationGo
Content

Templates

Charts & Diagrams

Text & Tables

Graphics & Metaphors

Timelines & Planning

Maps

AI ImagesNEW

Best-Ofs & Tips

Legal

Terms and Conditions

Privacy Statement

Cookie Policy

Digital Millennium Copyright Act (DMCA) Policy

Disclaimer

Help

Contact us

FAQ

Templates

Charts & Diagrams

Text & Tables

Graphics & Metaphors

Timelines & Planning

Maps

Best-Ofs & Tips

Terms and Conditions

Privacy Statement

Cookie Policy

Digital Millennium Copyright Act (DMCA) Policy

Disclaimer

Contact us

FAQ

© Copyright 2026 Ofeex | PRESENTATIONGO® is a registered trademark | All rights reserved.

PresentationGO
Cookies & Privacy

To provide the best experiences, we and our partners use technologies like cookies to store and/or access device information. Consenting to these technologies will allow us and our partners to process personal data such as browsing behavior or unique IDs on this site and show (non-) personalized ads. Not consenting or withdrawing consent, may adversely affect certain features and functions.

Click below to consent to the above or make granular choices. Your choices will be applied to this site only. You can change your settings at any time, including withdrawing your consent, by using the toggles on the Cookie Policy, or by clicking on the manage consent button at the bottom of the screen.

Functional Always active
Needed for the website to work properly.
Preferences
Remember your settings (like language or display choices).
Statistics
The technical storage or access that is used exclusively for statistical purposes. Help us understand how the site is used so we can improve it (Google Analytics).
Marketing
Used to show relevant ads and measure ad performance (Google AdSense and partners).
Statistics

Marketing

Features
Always active

Always active
  • Manage options
  • Manage services
  • Manage {vendor_count} vendors
  • Read more about these purposes
Manage preferences
  • {title}
  • {title}
  • {title}
PresentationGO
Cookies & Privacy

We use cookies to run the site, measure traffic, and show ads that help keep our downloads free. Manage your choices anytime.

Functional Always active
Needed for the website to work properly.
Preferences
Remember your settings (like language or display choices).
Statistics
The technical storage or access that is used exclusively for statistical purposes. Help us understand how the site is used so we can improve it (Google Analytics).
Marketing
Used to show relevant ads and measure ad performance (Google AdSense and partners).
Statistics

Marketing

Features
Always active

Always active
  • Manage options
  • Manage services
  • Manage {vendor_count} vendors
  • Read more about these purposes
Manage preferences
  • {title}
  • {title}
  • {title}

Thank you for downloading from PresentationGO!

AI Images are free to use with no attribution required (though appreciated).

Presentation templates are also free, but require attribution.
For example, you can include this credit somewhere visible:

If you enjoy our free resources and want to support us, you can:

Buy us a coffee

Thank you for your continued support!