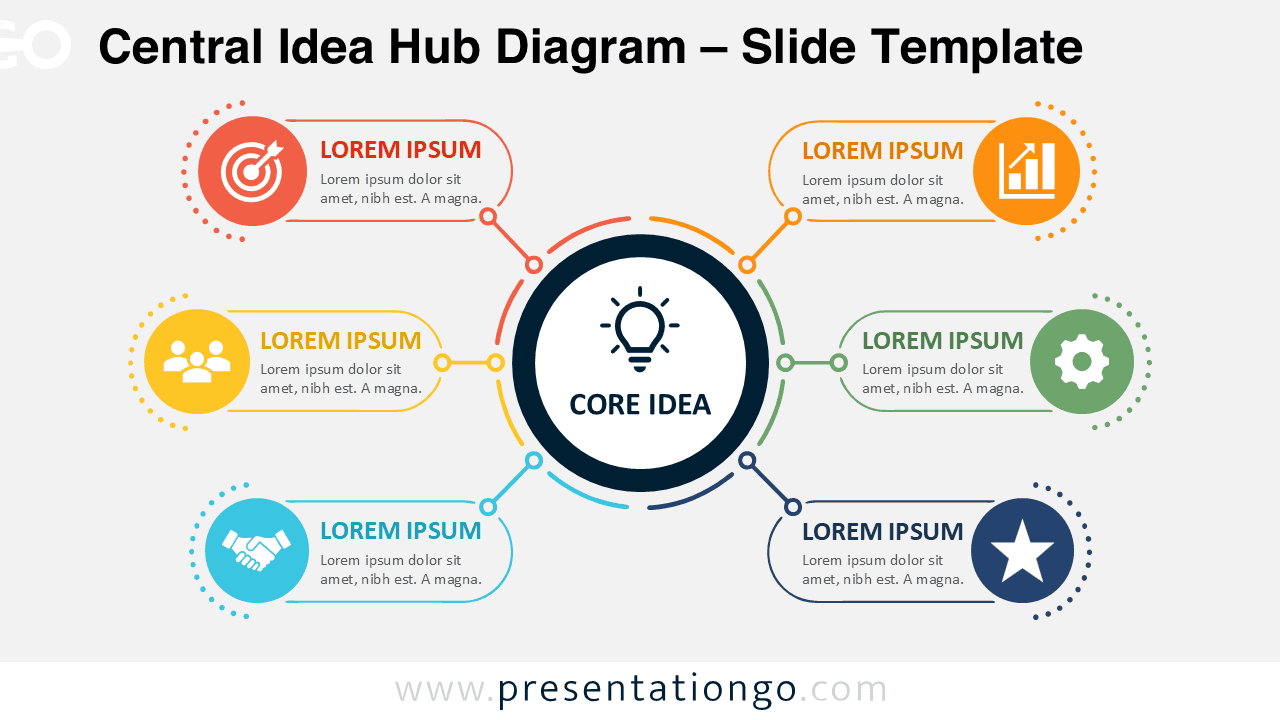
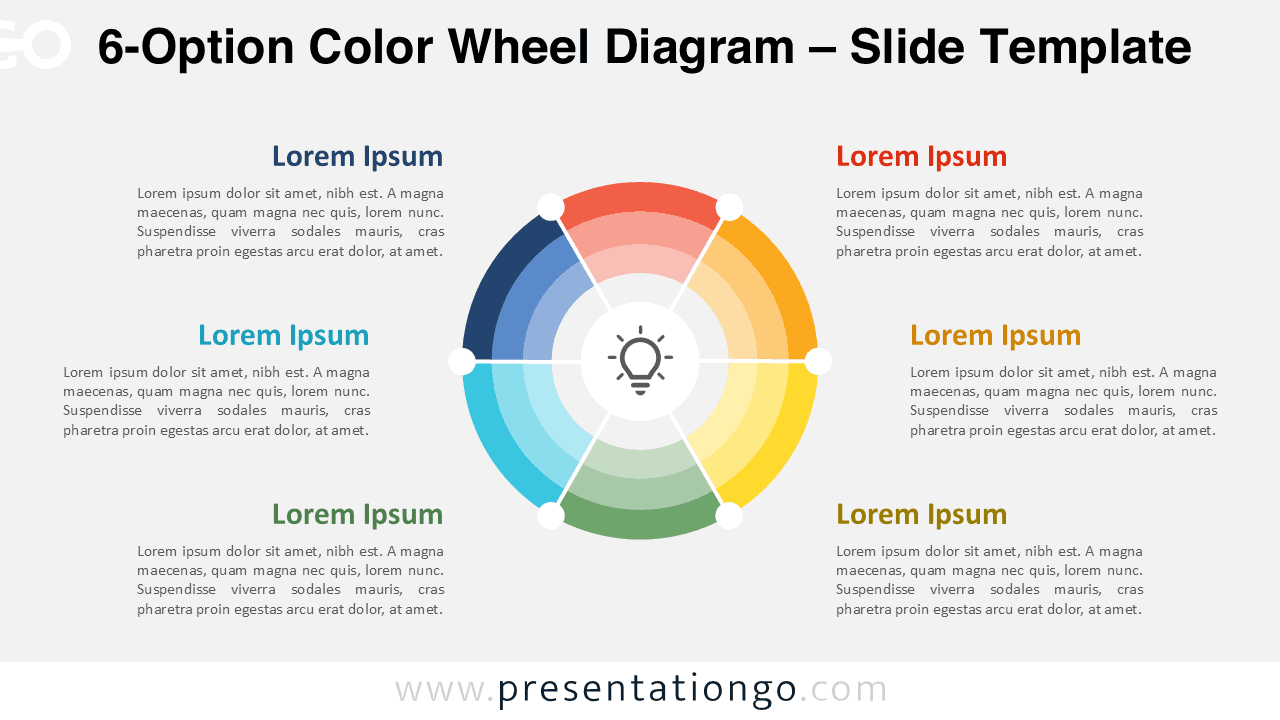
Present six related ideas around one central concept with an editable radial diagram for PowerPoint and Google Slides.
Google Slides, PPTX
16:9
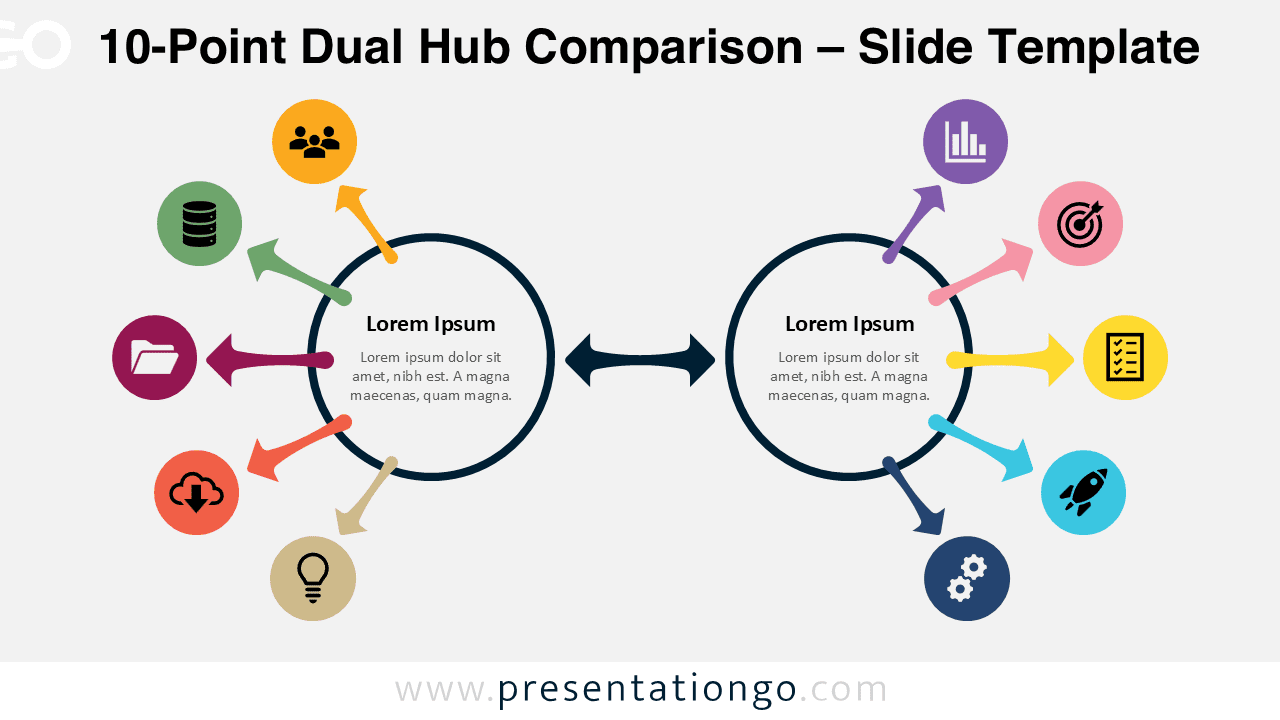
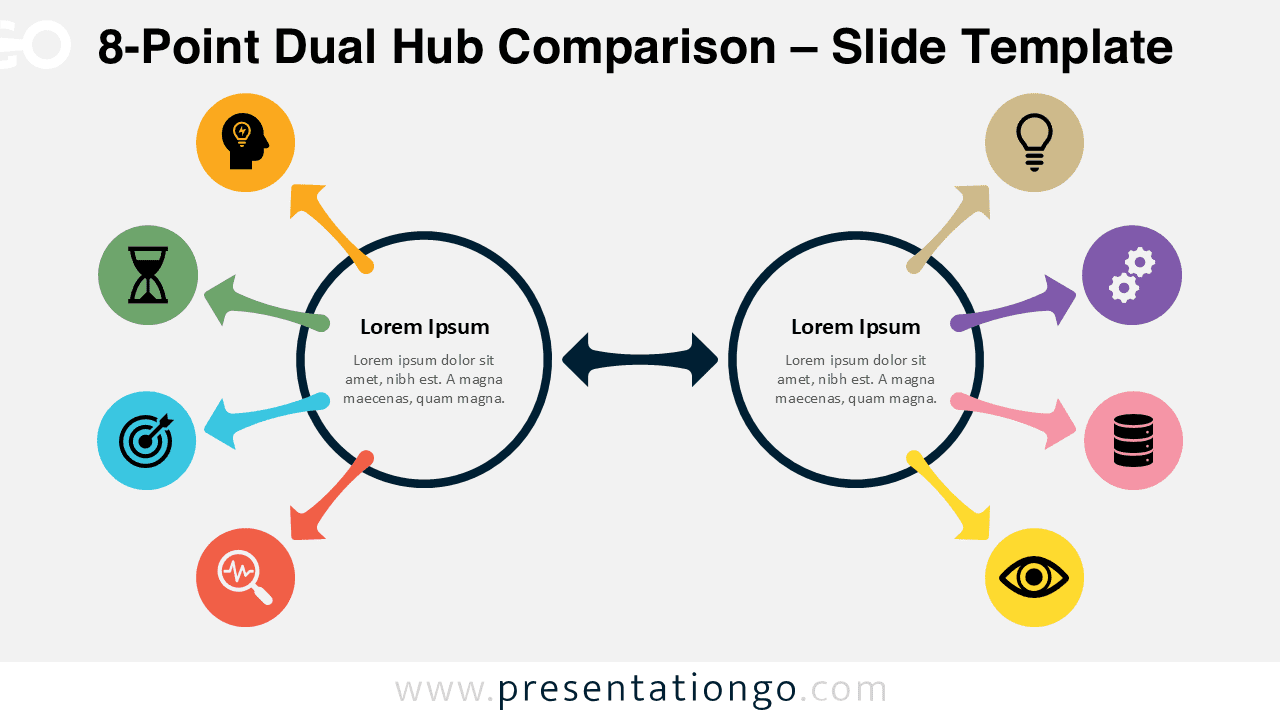
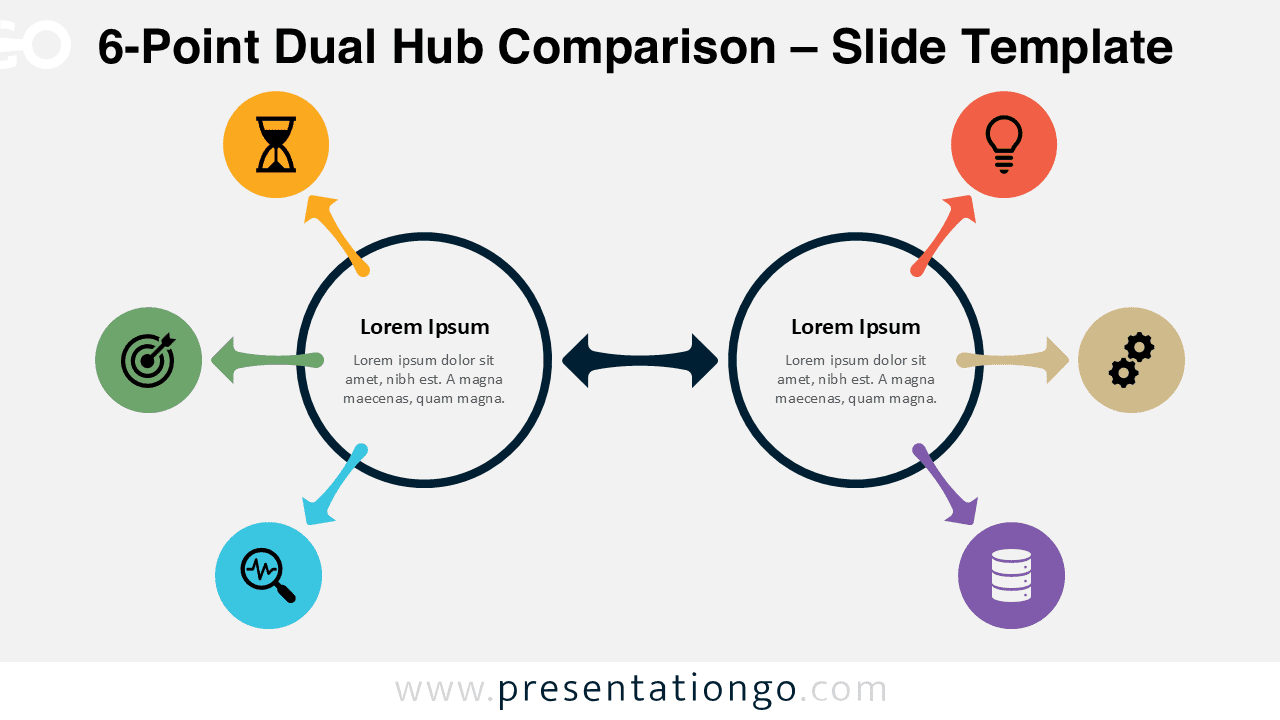
Browse our extensive collection of 125 radial diagram templates for PowerPoint and Google Slides, ideal for representing complex relationships and interconnections in a visually appealing manner. Our templates are designed with a professional touch, ensuring your presentation captures your audience’s attention.
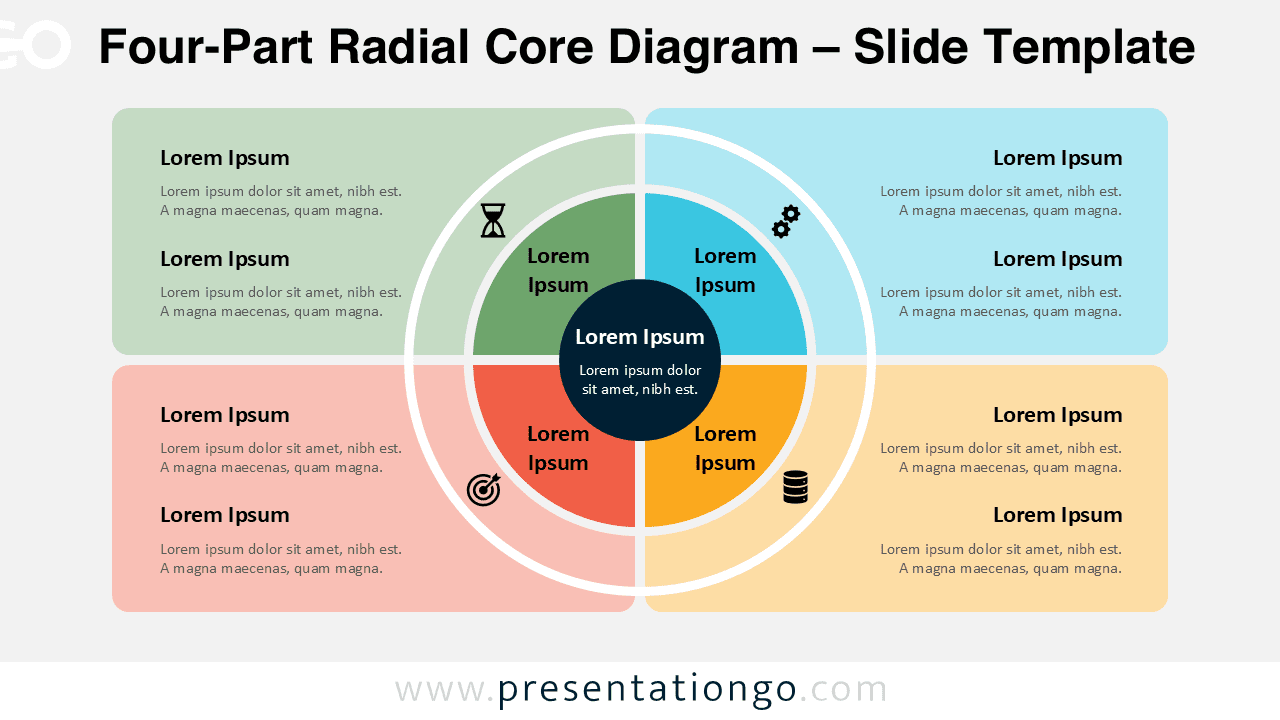
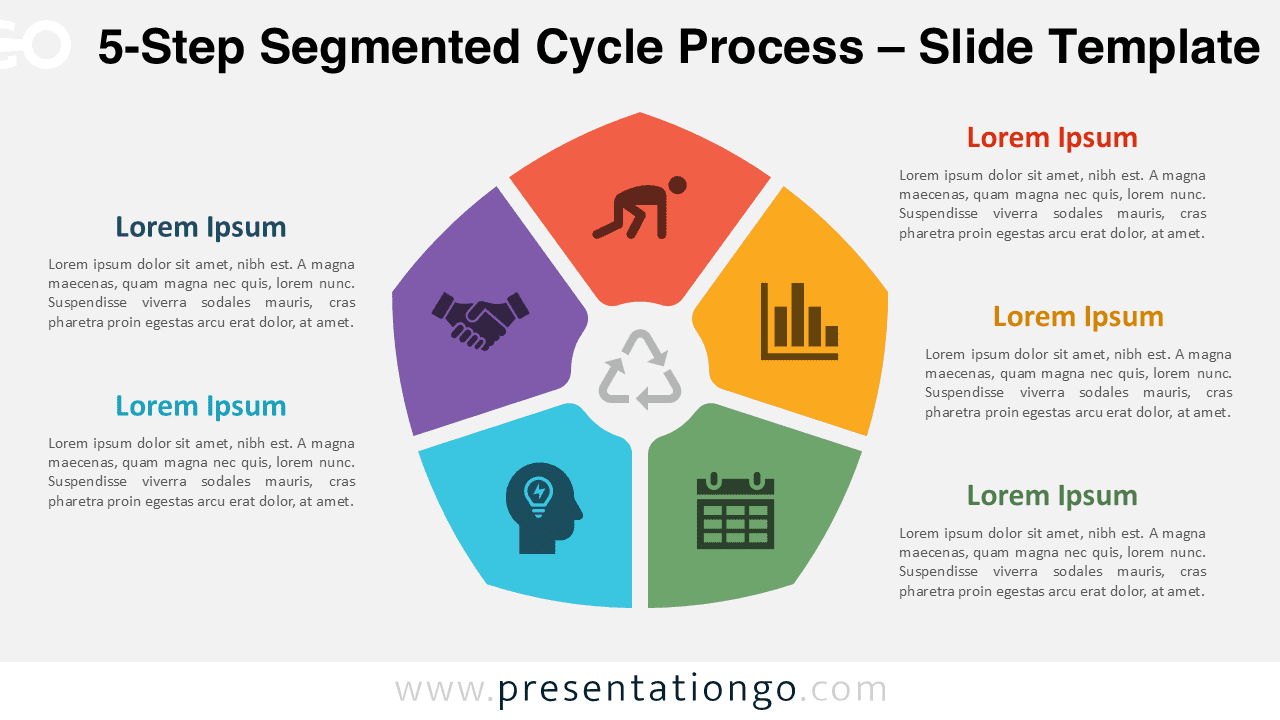
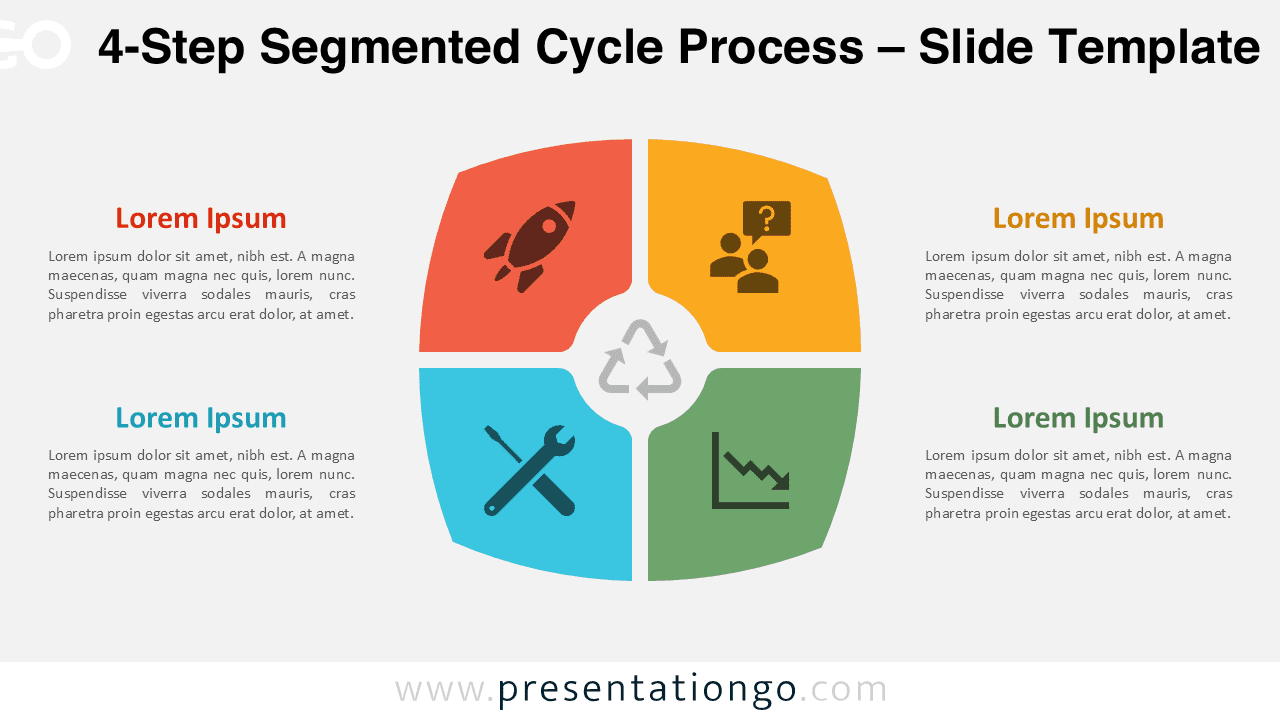
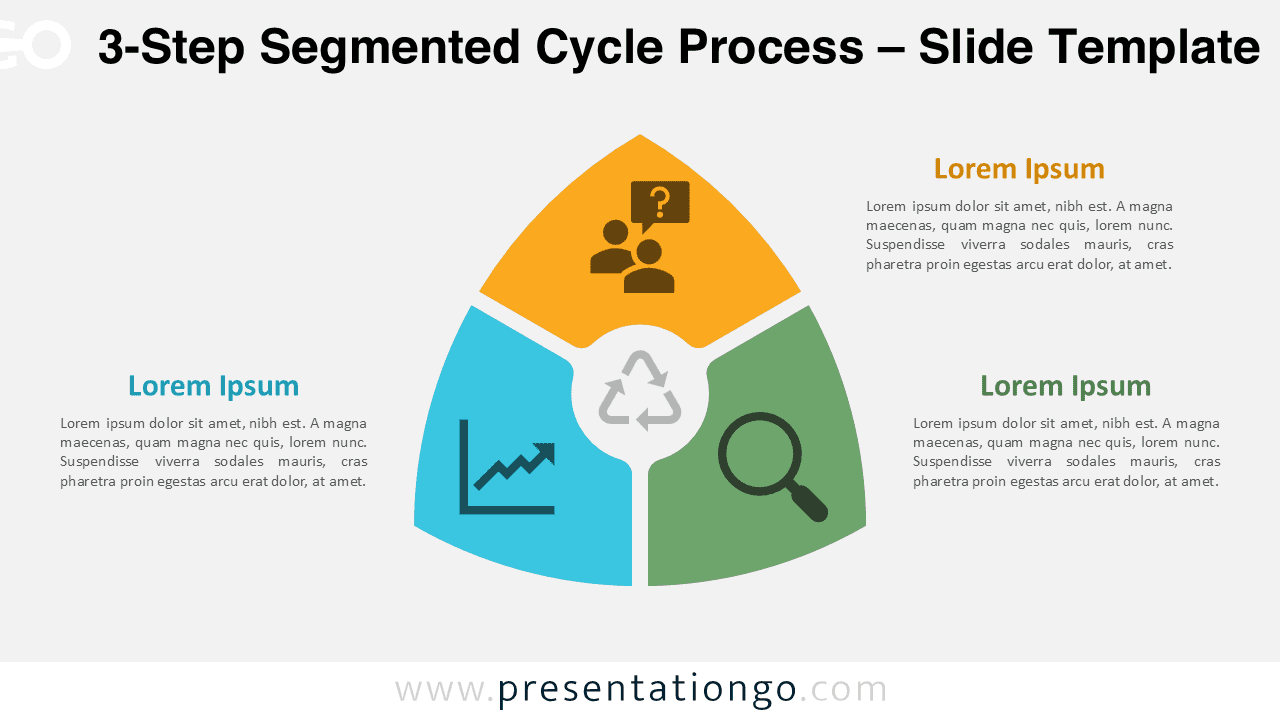
Radial diagrams are circular charts used to display data or concepts in a visually engaging way. They are perfect for illustrating relationships, hierarchies, or processes where multiple elements are connected to a central core.
Use our versatile radial diagram templates for various topics, such as project management, marketing, and strategic planning. They are especially useful for showcasing interconnected ideas, stages of a process, or relationships among different elements.
Google Slides, PPTX
16:9
Google Slides, PPTX
16:9
Google Slides, PPTX
16:9
Google Slides, PPTX
16:9
Google Slides, PPTX
16:9
Google Slides, PPTX
16:9
Google Slides, PPTX
16:9
Google Slides, PPTX
16:9
Google Slides, PPTX
16:9
Google Slides, PPTX
16:9
Google Slides, PPTX
16:9
Google Slides, PPTX
4:316:9
