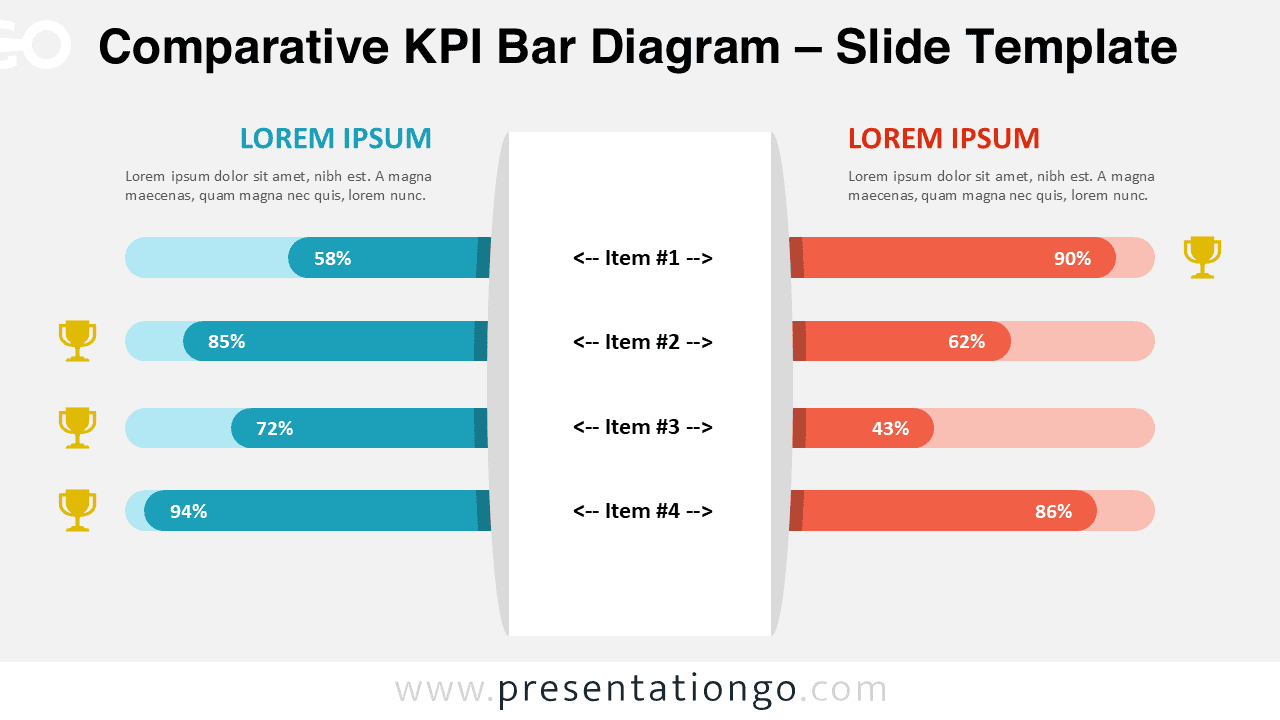
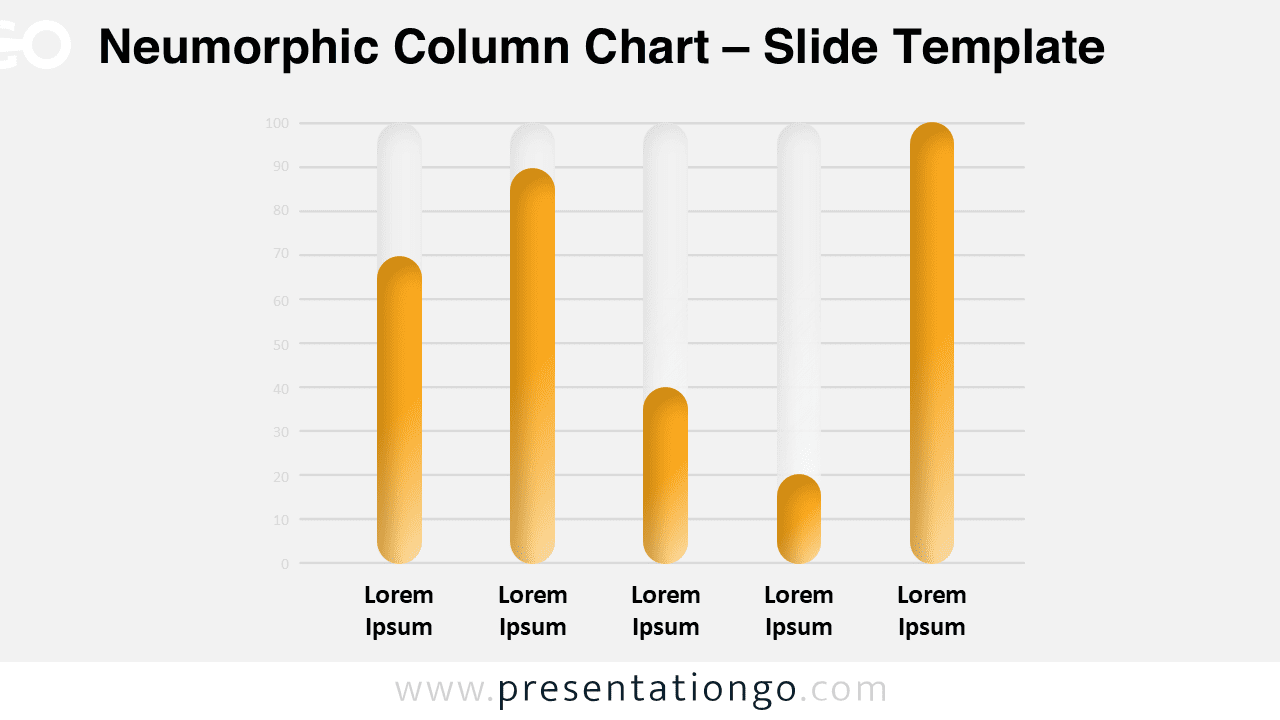
Not every comparison needs a dataset. These free infographic charts offer chart-style visuals for qualitative categories, concepts and relationships, editable in PowerPoint and Google Slides.
Download the Grid Fraction Charts template for PowerPoint and Google Slides to visualize and compare data with customizable circle grids.
Google SlidesPPTX
4:3,16:9
Showing 1–13 of 78 templates
Cookies & Privacy
To provide the best experiences, we and our partners use technologies like cookies to store and/or access device information. Consenting to these technologies will allow us and our partners to process personal data such as browsing behavior or unique IDs on this site and show (non-) personalized ads. Not consenting or withdrawing consent, may adversely affect certain features and functions.
Click below to consent to the above or make granular choices. Your choices will be applied to this site only. You can change your settings at any time, including withdrawing your consent, by using the toggles on the Cookie Policy, or by clicking on the manage consent button at the bottom of the screen.
Functional
Always active
Needed for the website to work properly.
Preferences
Remember your settings (like language or display choices).
Statistics
The technical storage or access that is used exclusively for statistical purposes.Help us understand how the site is used so we can improve it (Google Analytics).
Marketing
Used to show relevant ads and measure ad performance (Google AdSense and partners).
We use cookies to run the site, measure traffic, and show ads that help keep our downloads free. Manage your choices anytime.
Functional
Always active
Needed for the website to work properly.
Preferences
Remember your settings (like language or display choices).
Statistics
The technical storage or access that is used exclusively for statistical purposes.Help us understand how the site is used so we can improve it (Google Analytics).
Marketing
Used to show relevant ads and measure ad performance (Google AdSense and partners).