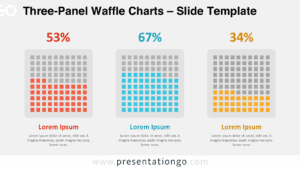
The Grid Fraction Charts diagram for PowerPoint and Google Slides, showcases three fraction charts composed of 100 circles each, effectively illustrating proportional data.
Fractional Data Visualization to Compare Quantitative Results
This template features a clear grid layout of 10 rows and 10 columns of circles, where a portion of these circles is filled to represent different fractions. Each chart is accompanied by a percentage number at the top, providing numerical clarity. Beneath each chart, there is a space for a title and descriptive text, allowing users to add context or relevant explanations.
The Grid Fraction Charts template can be utilized in various contexts such as business reports, educational presentations, and project proposals. For instance, a business analyst might use it to display market share percentages, while a teacher could illustrate class attendance rates. The visual representation makes it easy for the audience to understand complex data at a glance, and the descriptive text areas enable detailed explanations. For example, in a sales meeting, the charts could show quarterly sales distributions with accompanying insights in the text below each chart, ensuring the audience fully grasps the data’s implications.
This presentation template includes 2 unique slides, pre-populated with number and text placeholders. The shapes are fully customizable, giving users complete control over the visual elements. It offers options for both light and dark themes, and is available in both Standard (4:3) and Widescreen (16:9) ratios. Users can download it in PowerPoint PPTX and Google Slides formats. To customize the template, users can adjust the colors to match their brand, modify the text for specific data points, or add icons for enhanced visual appeal.
Download the Grid Fraction Charts template today and make your data presentations clear and impactful.
Widescreen (16:9) size preview:


This template offers:
- 2 unique slides
- Options for both light and dark themes
- Pre-populated with numbers and text placeholders
- Fully customizable shapes for complete control
- Available in both Standard (4:3) and Widescreen (16:9) ratios
- Offered in both PowerPoint PPTX and Google Slides formats