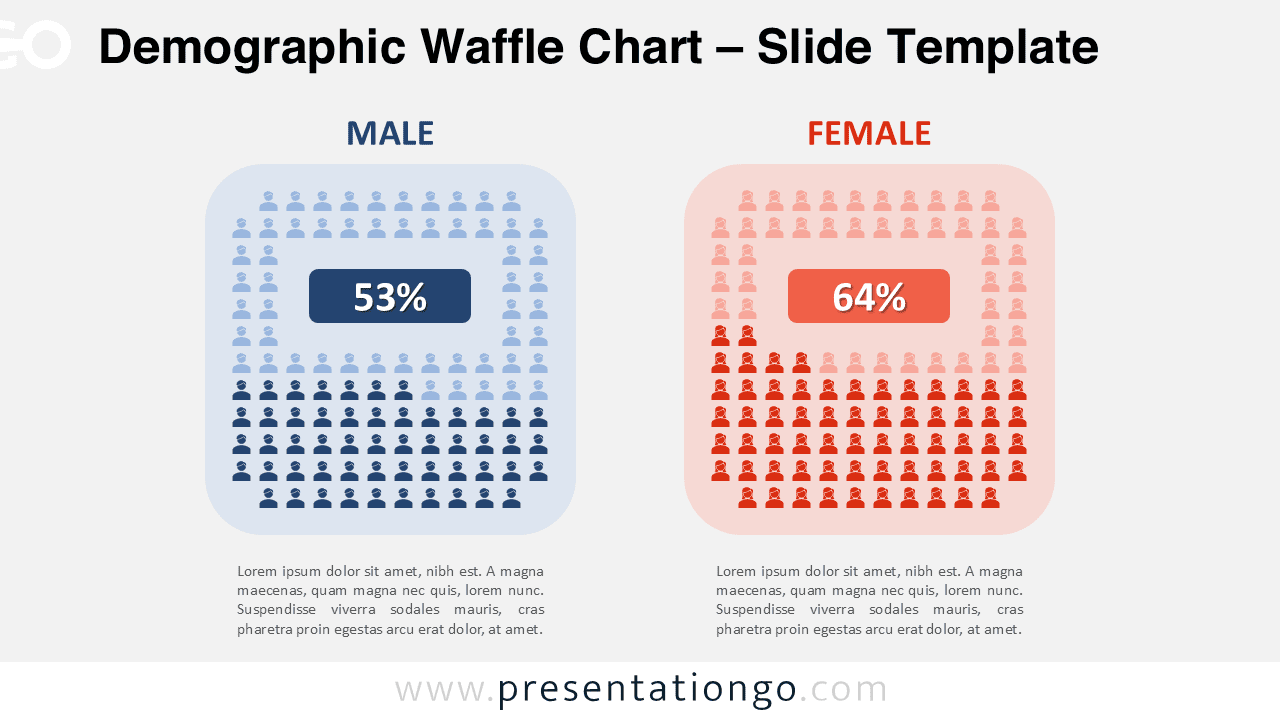
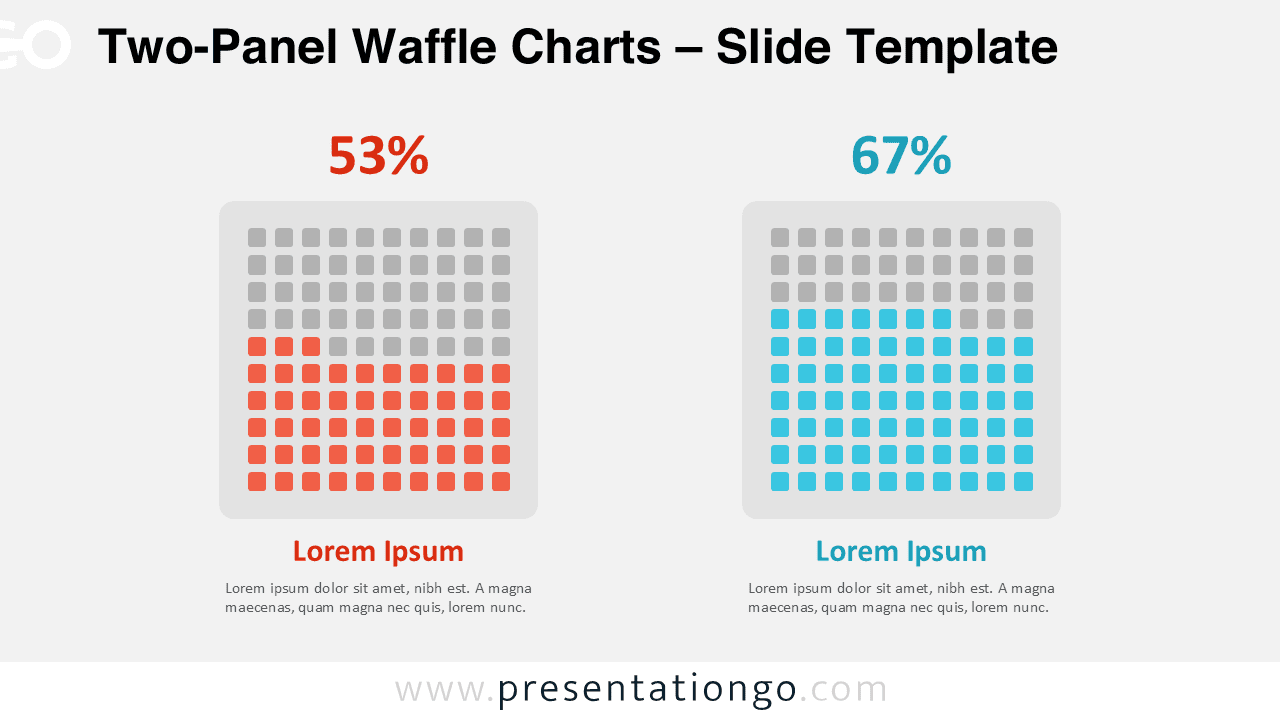
A clear and customizable waffle chart to compare male and female data with 100-icon grids for precise visual communication.
Google Slides, PPTX
4:316:9
Uncover our collection of waffle chart templates for PowerPoint and Google Slides, perfect for presenting data, proportions, and percentages in a visually appealing and engaging format. These professionally designed templates make it easy to display complex information in an easily digestible manner.
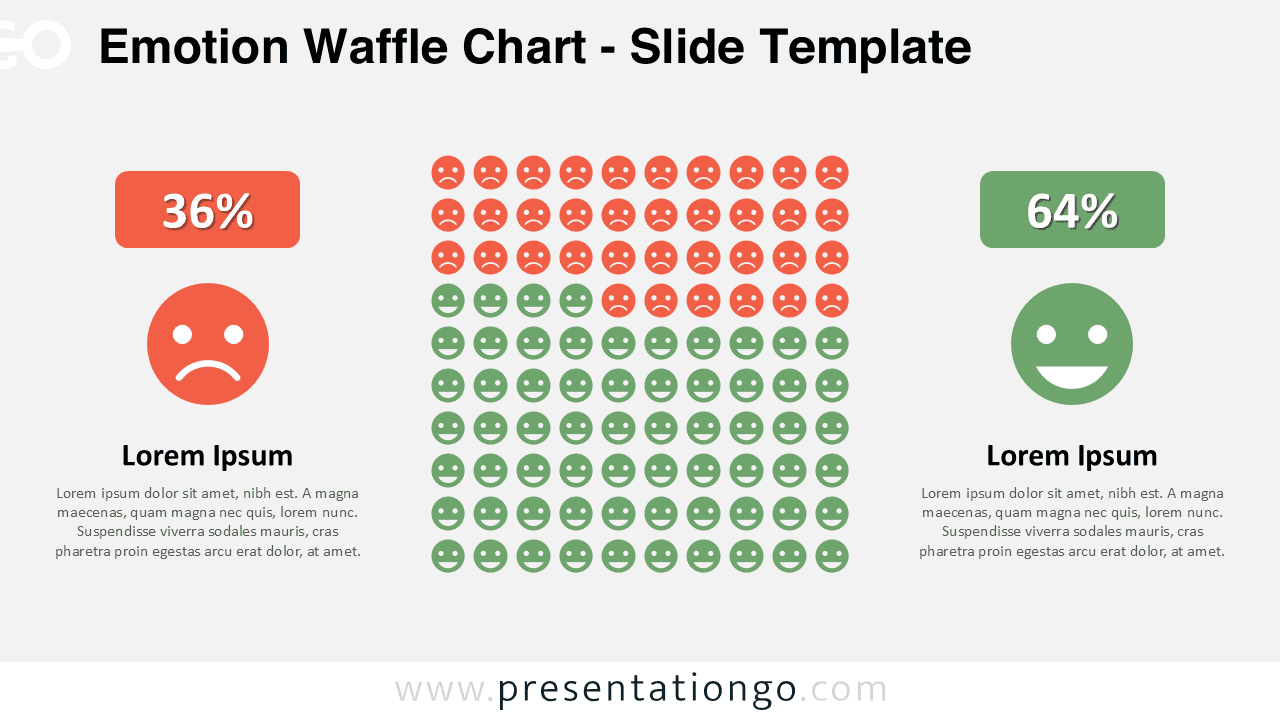
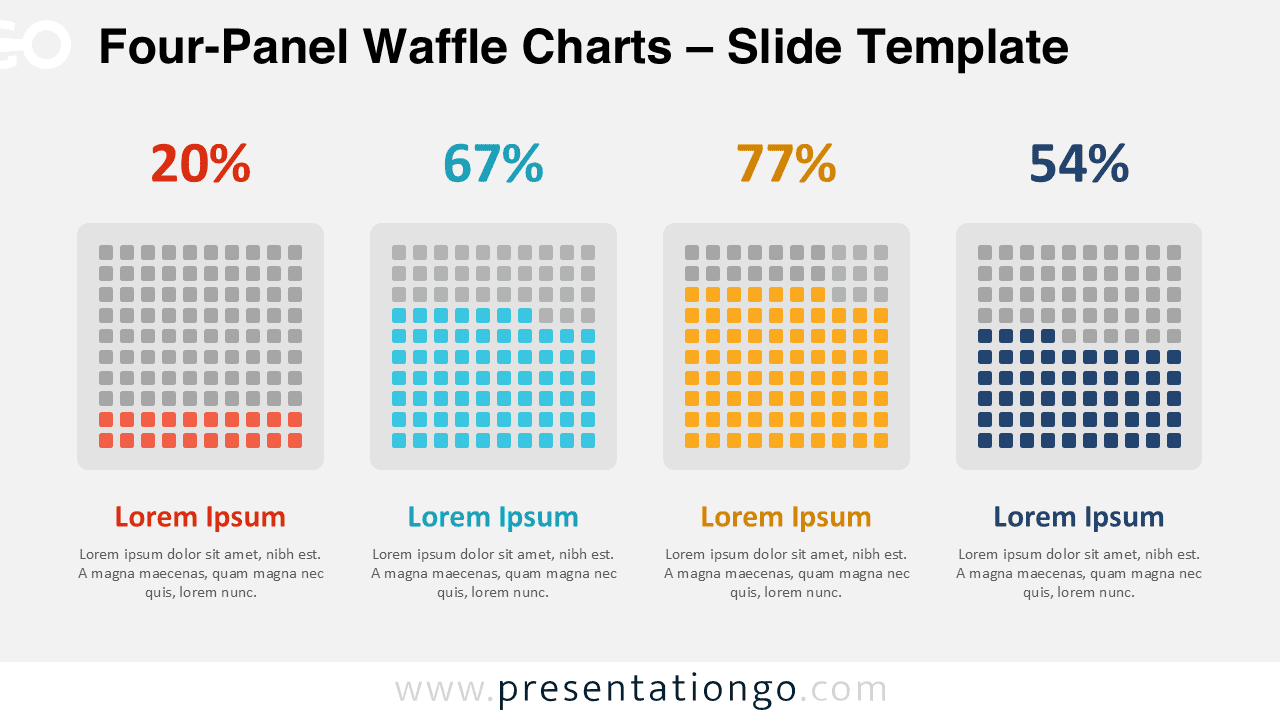
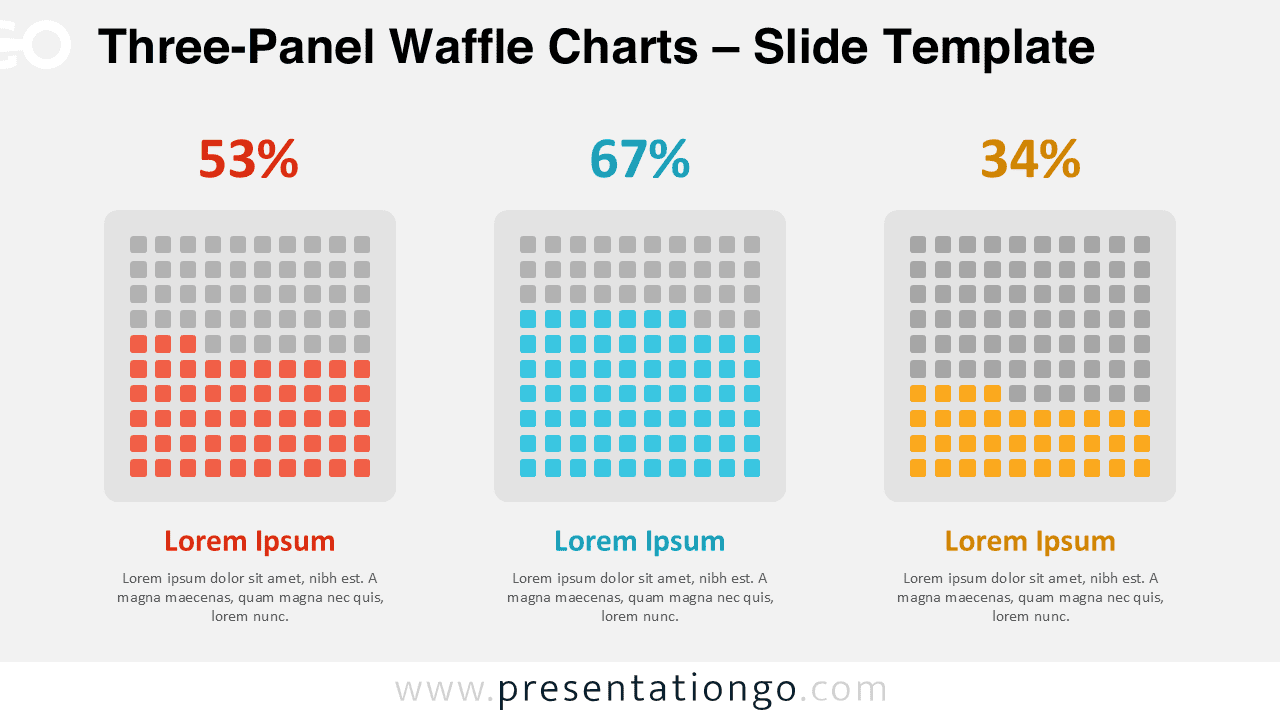
Waffle charts are grid-based visualizations used to represent data as a percentage or proportion. They display values in a grid format, with each cell representing a specific percentage, making it easy to understand and compare data points.
Waffle charts are ideal for presentations involving data analysis, performance metrics, progress tracking, and more.
These visual templates fit standard 4:3 and widescreen 16:9 slide formats. The fully customizable graphics work on light and dark backgrounds, ready for your presentations. Edit colors, text, values and chart dimensions as needed to tailor waffle charts for any industry or topic. Unleash viewer engagement and simplify data storytelling with these adaptable graphics.
Google Slides, PPTX
4:316:9
Google Slides, PPTX
4:316:9
Google Slides, PPTX
4:316:9
Google Slides, PPTX
4:316:9
Google Slides, PPTX
4:316:9

Google Slides, PPTX
4:316:9

Google Slides, PPTX
4:316:9

Google Slides, PPTX
4:316:9
