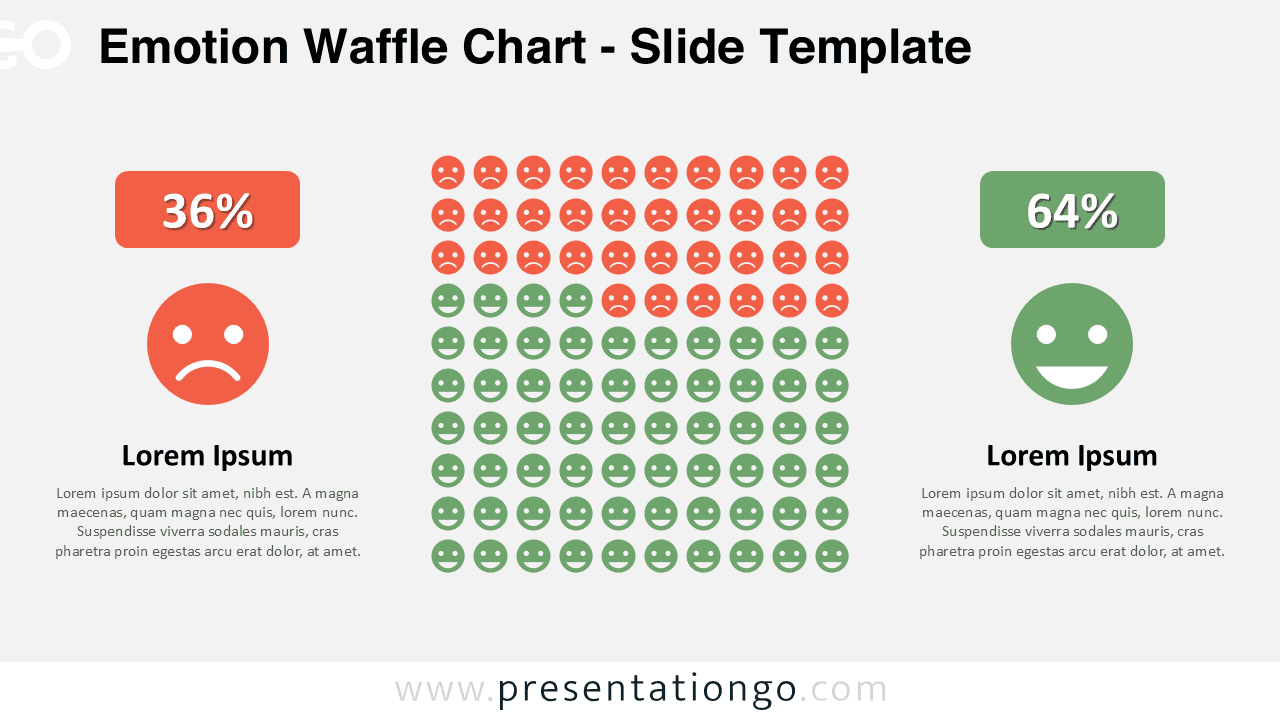
The Emotion Waffle Chart displays sentiment data through 100 circular face icons arranged in a 10×10 grid, designed for PowerPoint and Google Slides presentations.
Emotional Data Visualization with Clear Percent Breakdown
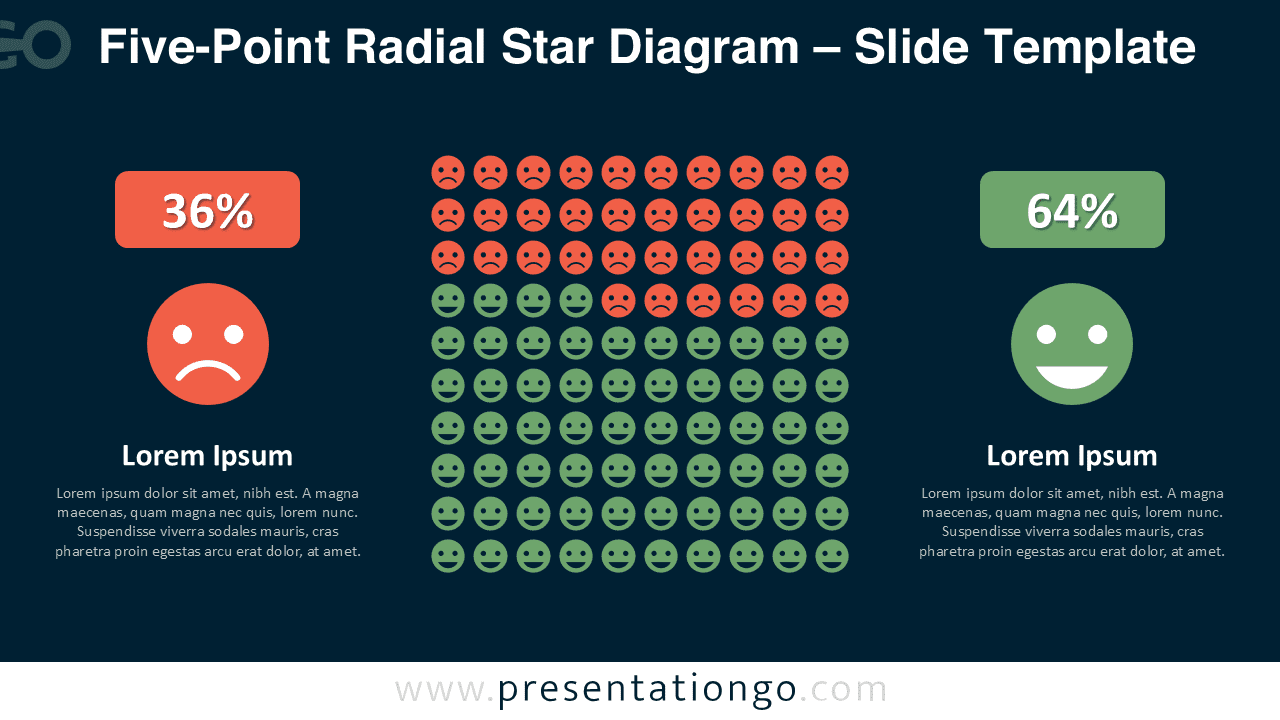
This waffle chart visualizes data using a 10×10 grid filled with 100 round face icons—each representing one percent of the total data. The top 36 icons feature red-toned frowny faces while the remaining 64 display green smiley faces. These expressive visuals are color-coded and aligned with two side panels that summarize the sentiment data. Each vertical side panel includes a large circular face icon, a percentage badge, a title, and a short explanation. The design is clean, mirrored, and emotion-focused—ideal for immediate recognition and comparison.
Waffle charts are often used to represent parts of a whole. Unlike pie or bar charts, they provide a more engaging visual through icon-based representations. This makes them highly suitable for surveys, feedback forms, or sentiment evaluations. When showcasing before-and-after data or comparing opposing feelings—like dissatisfaction vs. satisfaction—this chart format becomes invaluable. For example, HR departments might use it to depict employee morale, while marketing teams could present product feedback visually.
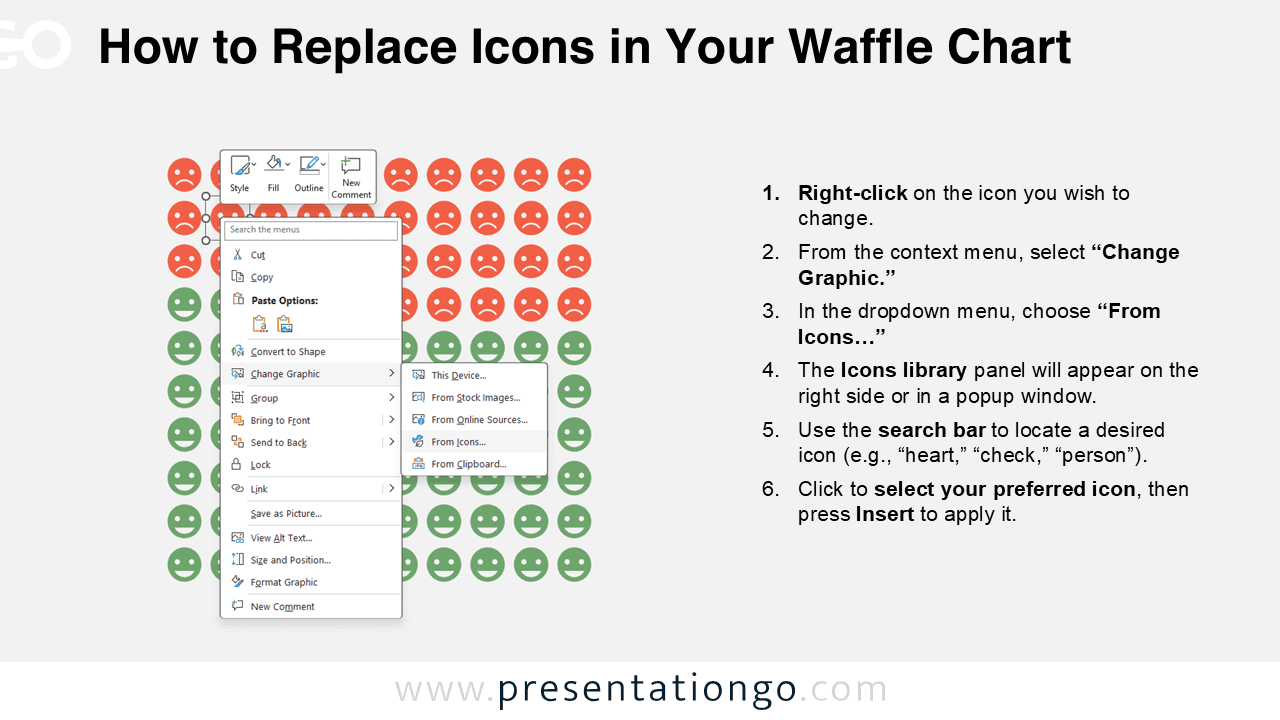
This downloadable template includes two slides, both pre-filled with icons and editable text boxes. It also features a helpful guide slide on how to modify icons. You can fully customize the visuals—including colors, texts, and icons—to suit your needs. Both light and dark background versions are available, and it comes in standard (4:3) and widescreen (16:9) formats for compatibility with PowerPoint and Google Slides.
Download this 2-part emotion waffle chart template to clearly visualize sentiment data through expressive, editable visuals.
Widescreen (16:9) size preview:


This template offers:
- 2 unique slides + 1 instruction slide on how to replace icons
- Options for both light and dark themes
- Pre-populated with icons, numbers, and text placeholders
- Fully customizable shapes for complete control
- Available in both Standard (4:3) and Widescreen (16:9) ratios
- Offered in both PowerPoint PPTX and Google Slides formats