The Venn Comparison Diagram helps you compare two options with a clear visual structure. It places two main option blocks around a central connector, so viewers understand relationships fast. Use it to present alternatives, explain decisions, or show how two ideas meet around one shared point.
Diagram Preview
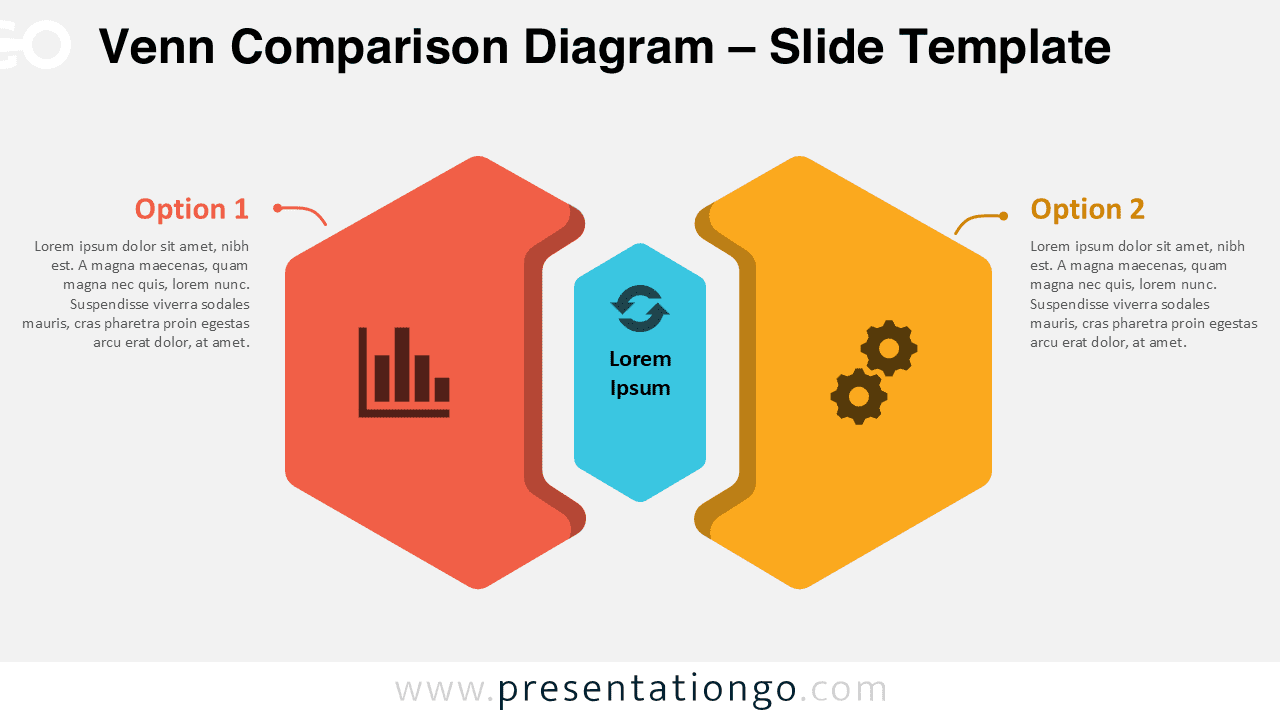
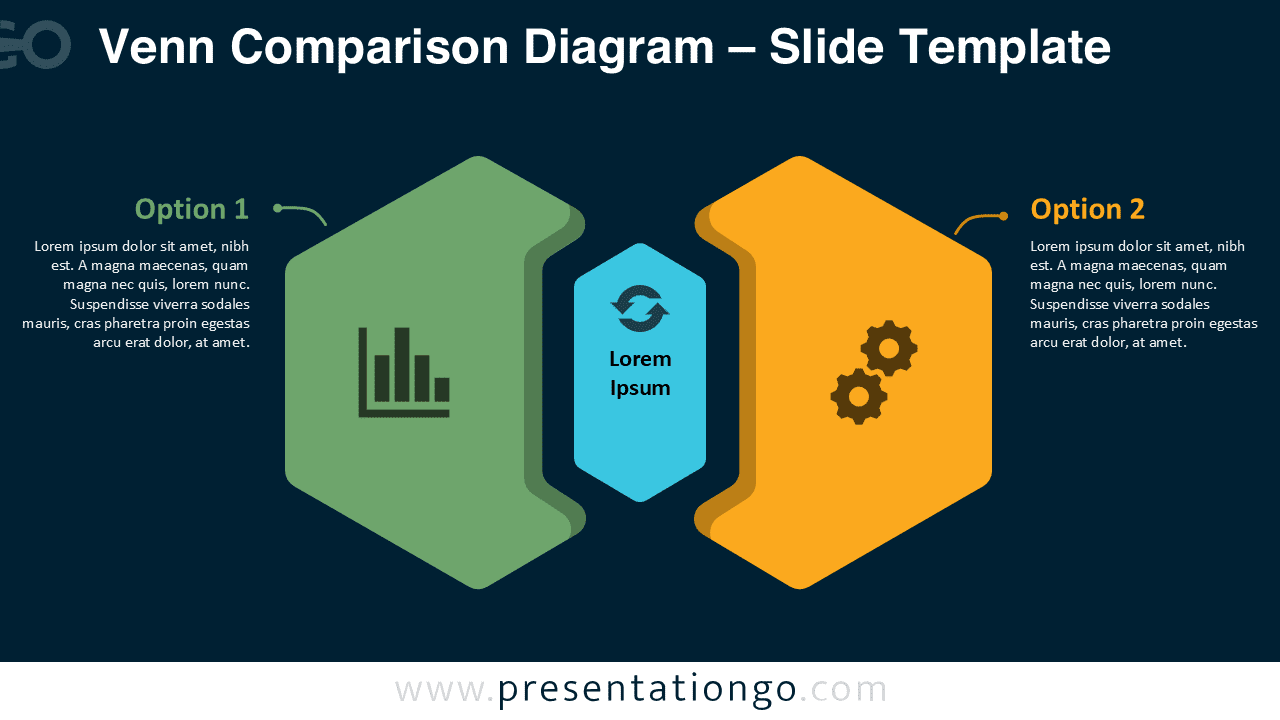


Diagram Features and Customization Options
- Includes two large option areas for comparing ideas, actions, strategies, or business paths.
- Uses a central connector shape to highlight links, shared outcomes, or mutual influence.
- Includes chart, cycle, and gear icons from the Office icon library.
- Lets you modify, replace, resize, or restyle the icons easily inside your presentation software.
- Provides editable text placeholders for option titles, descriptions, and central labels.
- Works in both PowerPoint and Google Slides for flexible editing and sharing.
- Supports quick adaptation for business, education, consulting, marketing, and planning decks.
Design and Structure
The Venn Comparison Diagram uses a balanced two-side layout with a central visual anchor. Each side represents one option, while the middle section shows connection, exchange, or overlap. This structure helps audiences compare separate ideas without losing sight of their relationship.
The diagram uses large geometric shapes, simple icon placeholders, and short text blocks. This approach improves readability and keeps attention on the message. You can adjust the text, move elements, replace icons, or adapt the layout to match your own topic.
Practical Applications
- Compare two business strategies during planning meetings.
- Show trade-offs between two product ideas or service models.
- Explain two project paths with one shared objective.
- Present before-and-after analysis with a central transition point.
- Support decision-making workshops and stakeholder discussions.
- Visualize relationships between departments, teams, or processes.
- Frame pros and cons in a clean presentation format.
Summary
The Venn Comparison Diagram offers a simple and effective way to compare two connected ideas. Its editable structure helps you present choices, relationships, and shared outcomes with clarity. Use it in PowerPoint or Google Slides to build stronger decision-focused slides with less effort.