The Dual Thermometer Gauge provides a clear visual way to compare two values in a single slide. It uses two vertical thermometer-style scales positioned side by side, making differences easy to identify at a glance. Percentage callouts can point directly to specific positions on each scale, while surrounding text areas provide room for titles and supporting information.
Designed for PowerPoint and Google Slides, this graphic works well when numbers need more visual emphasis than a standard table or text box can provide. The balanced structure supports comparisons between two options, periods, targets, teams, products, or performance indicators. Its familiar thermometer metaphor also makes measured levels immediately understandable.
Diagram Preview
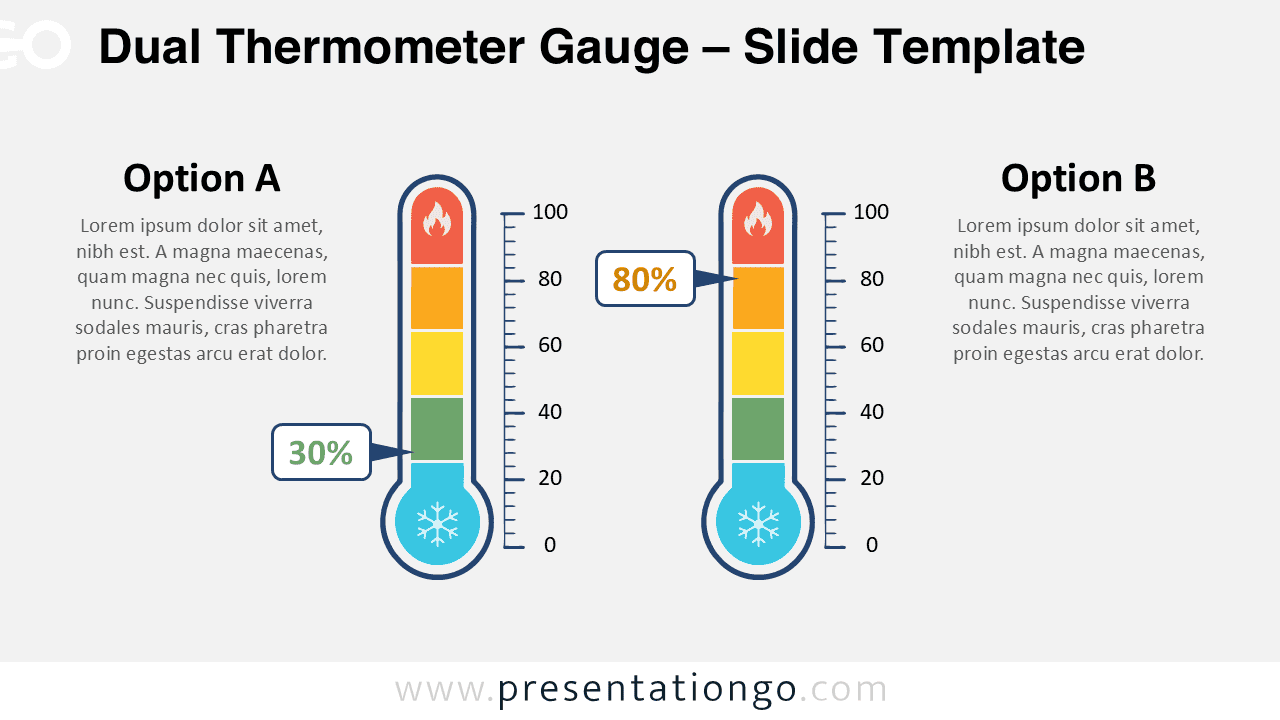
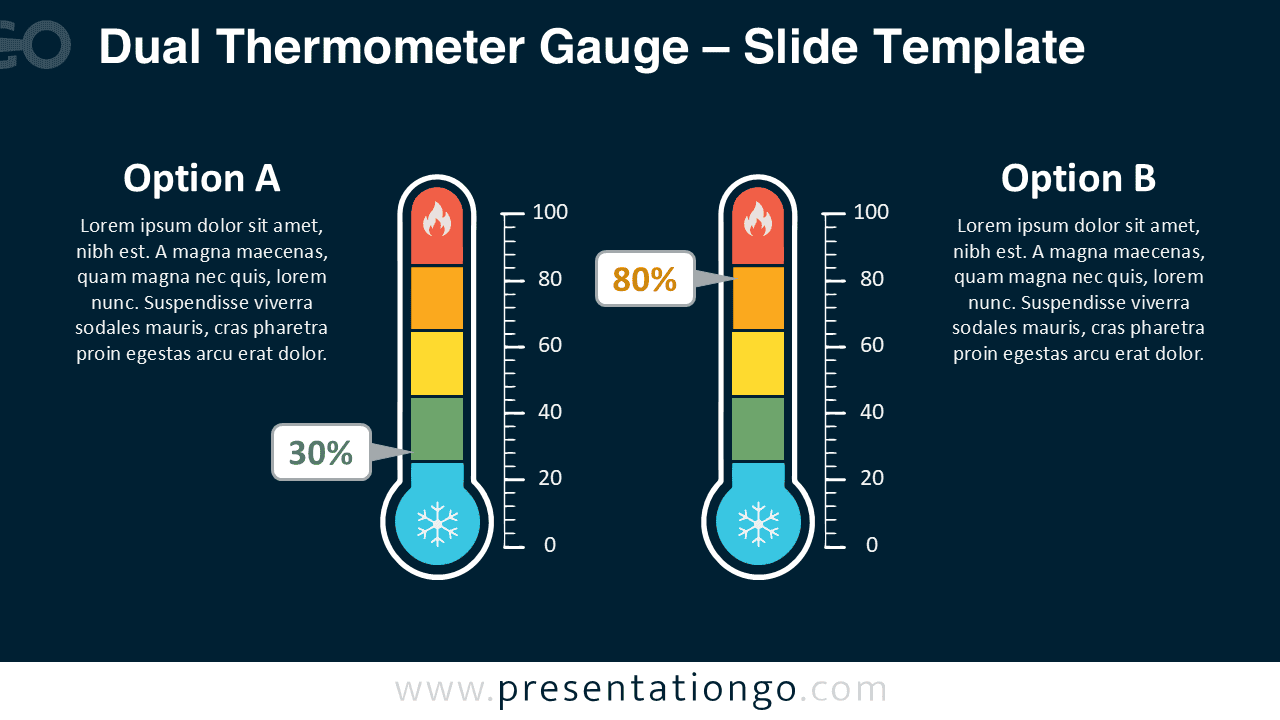


The Dual Thermometer Gauge is supplied in two slide versions so you can use the same visual structure across different presentation styles. Both versions retain the same arrangement, scales, percentage markers, text areas, and editable graphic elements.
Features and Customization Options
- Compatible with Microsoft PowerPoint and Google Slides
- 2 slides with the same editable layout
- Editable text, shapes, scales, and percentage callouts
- Editable icons, easy to modify or replace
- Includes both light and dark background versions
Design and Structure
The composition centers on two matching vertical gauges with numbered scales running from zero to one hundred. Each gauge contains stacked level sections and a circular base, while percentage callouts point toward selected positions. Text areas on both sides keep explanations visually separate from the main comparison.
The Dual Thermometer Gauge uses a symmetrical structure that keeps both values equally prominent. You can edit the percentages, scale labels, titles, descriptions, shapes, and icon elements directly in your presentation software. The flame and snowflake icons come from the Microsoft Office icon library, so they can be resized, modified, or replaced easily.
Practical Applications
- Compare two performance levels or KPI results
- Show progress toward separate targets
- Present satisfaction or approval ratings
- Visualize risk, severity, or intensity levels
- Compare before-and-after measurements
- Present benchmark results for two options
- Illustrate capacity, completion, or status levels
Summary
The Dual Thermometer Gauge turns two numerical values into a straightforward visual comparison. Its paired scales, editable percentage callouts, and supporting text areas make it useful for many business, educational, analytical, and reporting contexts.
Because every main element can be edited in PowerPoint or Google Slides, you can quickly adapt the graphic to your own data and presentation needs. Use it whenever two levels or measurements need to be compared clearly without relying on a conventional chart.