The Demographic Waffle Chart provides a visual method for comparing gender-based statistics through 100-icon grids designed for PowerPoint and Google Slides presentations.
Compare Population Segments Using Icon-Based Waffle Charts
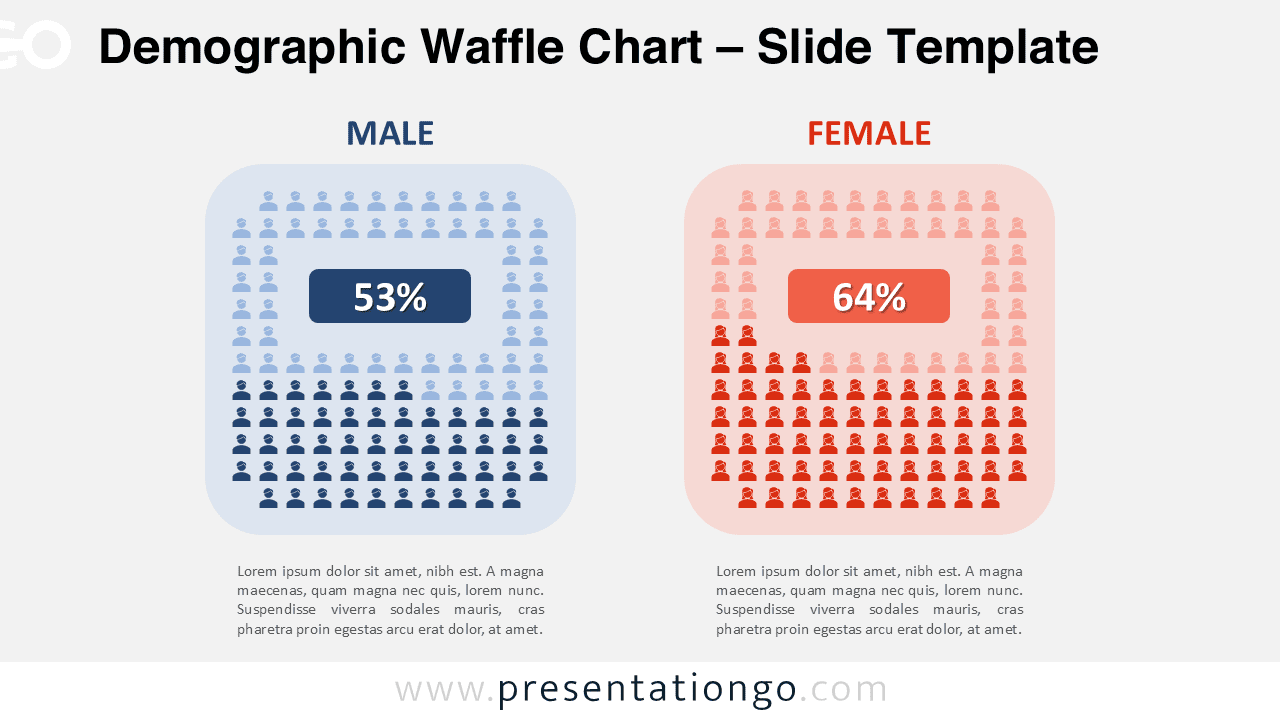
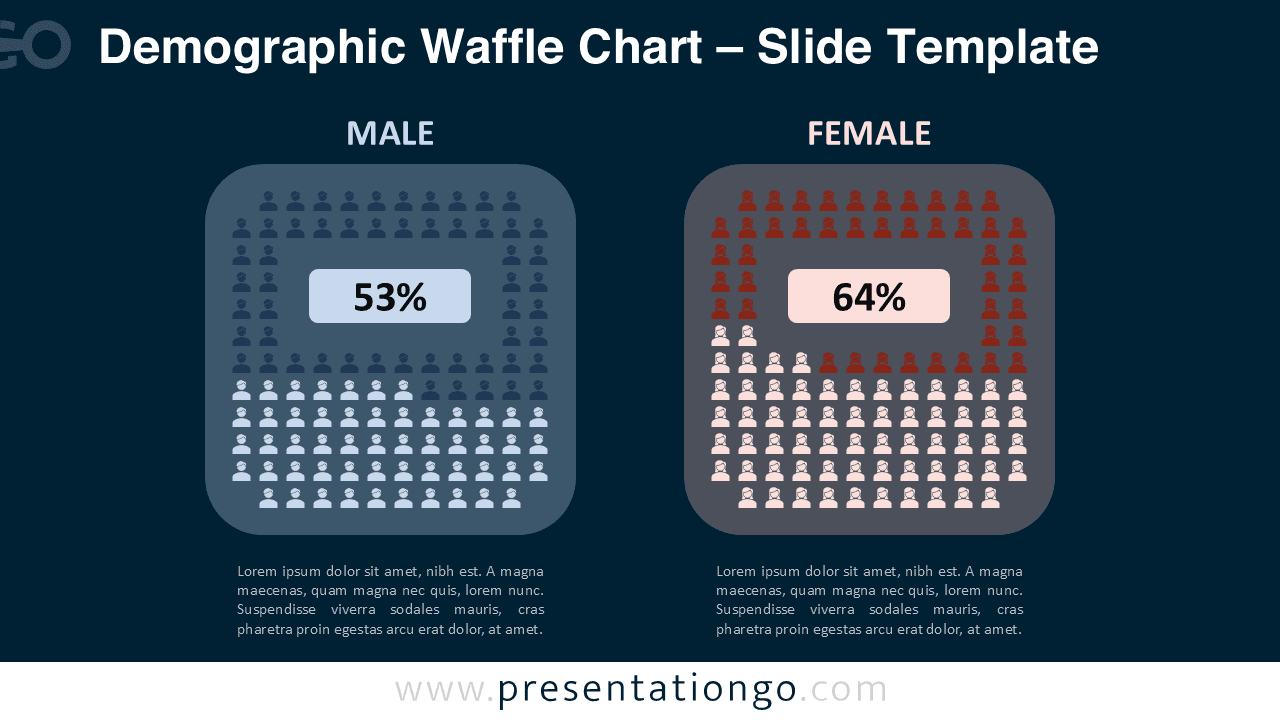
This demographic slide template presents two horizontally aligned waffle charts marked “MALE” and “FEMALE,” each consisting of a 10×10 icon grid. These grids use gendered silhouettes to symbolize percentage values—each icon equals 1%. Within each grid, darker icons represent the proportion stated at the center (e.g., 53%, 64%), while lighter ones denote the remainder. Rounded boxes encase the visuals, with pill-shaped central labels highlighting the percentage figures. Below each section, a text placeholder is available to elaborate on the data shown.
Waffle charts are used to convey percentages in a compact and intuitive layout where each square equates to 1%—making it ideal for clear visual data interpretation. Presenters often use such charts to compare demographic groups, especially by gender, across topics like employment, education, healthcare, or survey results. The gender-specific iconography aids in quick recognition and engagement, allowing users to show behavioral or statistical differences between male and female groups efficiently. For example, an HR analyst might showcase workforce composition by gender, while a health researcher might compare screening rates.
This download includes two pre-filled slides with editable gender icons, percentage numbers, and placeholder text. Users can adjust the colors, icons, and labels to suit their data. The design supports both light and dark background themes and is offered in Standard (4:3) and Widescreen (16:9) layouts. It is fully compatible with both PowerPoint and Google Slides.
Download this gender comparison chart in 2 variations to present your demographic percentages accurately and engagingly.
Widescreen (16:9) size preview:


This template offers:
- 2 unique slides
- Options for both light and dark themes
- Pre-populated with icons, numbers, and text placeholders
- Fully customizable shapes for complete control
- Available in both Standard (4:3) and Widescreen (16:9) ratios
- Offered in both PowerPoint PPTX and Google Slides formats