Free round waffle chart with silhouettes for PowerPoint and Google Slides. A set of 100 male silhouettes forming a circle with colored ones to represent the data. Great for data visualization. Editable graphics with text placeholders.
Round Waffle Chart with Silhouettes
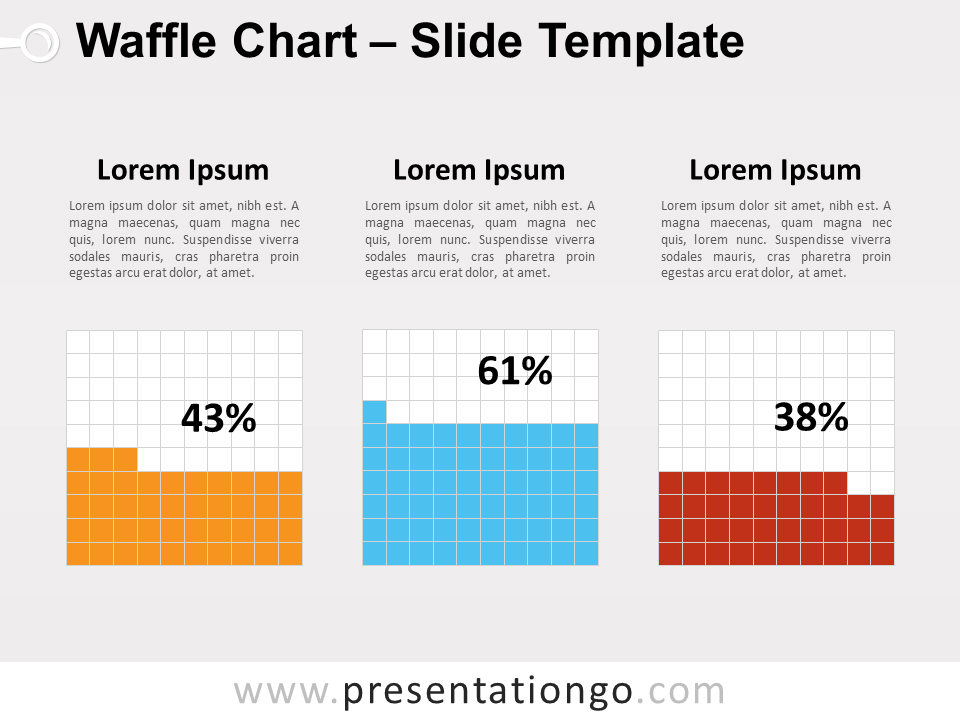
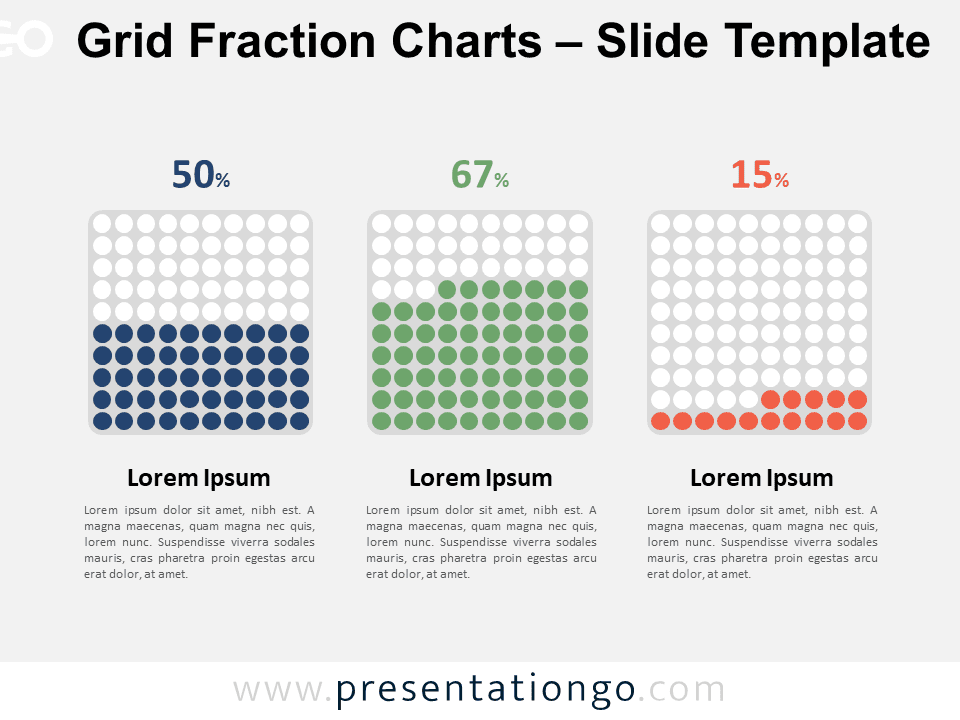
Waffle charts are very powerful infographics for data visualization. They are indeed very convenient charts to visualize and easily understand quantitative data, mainly a percentage. They are also sometimes used to illustrate progress toward a goal.
More specifically, this round waffle chart represents a group of 100 male silhouette icons forming a circle (or a globe). It is a very simple and straightforward chart: each silhouette represents 1 percentage point summing up to a total of 100%. The vivid color of the icons will show the data.
Also, if needed for your purpose, you customize it further. For example, you can mix male and female silhouettes with other icons (like children). To achieve that, just insert your selection of icons from the PowerPoint library. Of course, keep in mind that you need to make sure the total number of icons to be equal to 100!
Shapes are 100% editable: colors and sizes can be easily changed.
Includes 2 slide option designs: Standard (4:3) and Widescreen (16:9).
Widescreen (16:9) size preview:
This ‘Round Waffle Chart with Silhouettes for PowerPoint and Google Slides’ features:
- 2 unique slides
- Light and Dark layout
- Ready to use template with text placeholders
- Completely editable shapes
- Uses a selection of editable PowerPoint icons
- Standard (4:3) and Widescreen (16:9) aspect ratios
- PPTX file and for Google Slides
Free fonts used:
- Helvetica (System Font)
- Calibri (System Font)


