Free male and female fraction chart for PowerPoint and Google Slides. Infographic non-data-driven bar chart to visually showcase quantitative results about the population. Editable graphics with numbers and text placeholders.
Male – Female Fraction Chart
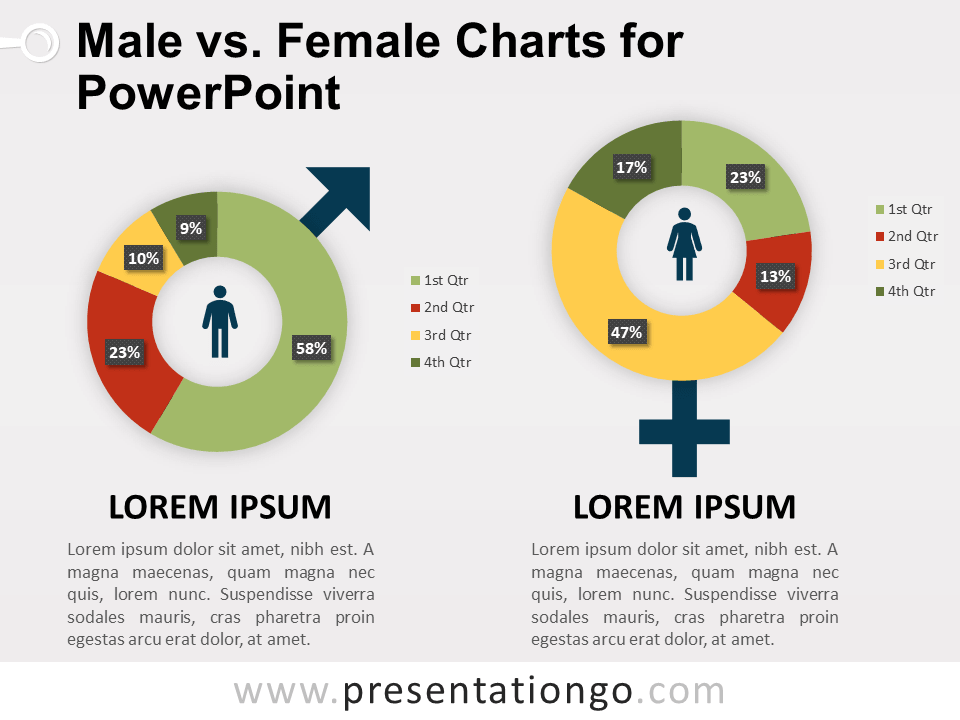
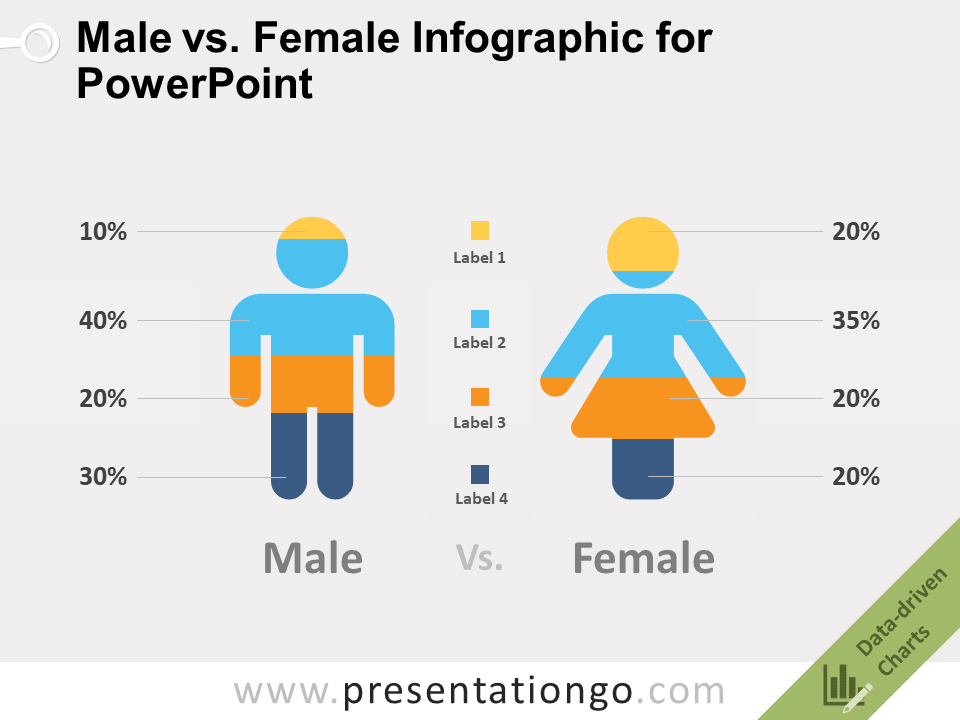
Do you want to illustrate statistics and percentages comparing the male and female populations? The tool you need is undoubtedly this free Male-Female Fraction Chart template!
This clear and attractive design includes four rectangles in which stand the silhouettes of ten men or women. By coloring some of them, you can express quantitative results. To explain your statistics or percentages even more clearly, you can write a short text or title below the bar chart. Moreover, you can make your numbers speak for themselves. Rectangles have indeed the shape of a speech bubble and you can add the number or percentage next to the tail of this speech rectangle.
As a matter of fact, this free Male-Female Fraction Chart template is the ideal infographic for Male vs Female comparisons. Thanks to such a clear and explicit design, your audience will remember and understand your statistics right away.
Usage instructions:
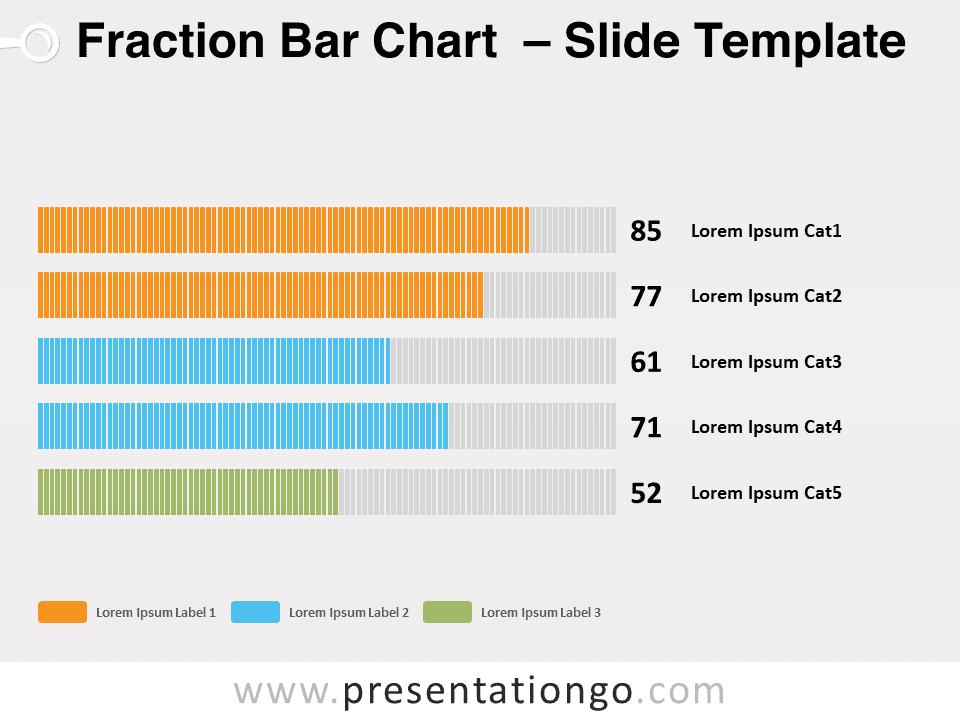
To adapt the length of the bar, just click the rectangle shape, hold, drag, and release.

Shapes are 100% editable: colors and sizes can be easily changed.
Includes 2 slide option designs: Standard (4:3) and Widescreen (16:9).
Widescreen (16:9) size preview:
This ‘Male – Female Fraction Chart for PowerPoint and Google Slides’ features:
- 2 unique slides
- Light and Dark layout
- Ready to use template with numbers and text placeholders
- Completely editable shapes
- Easily adjustable levels
- Standard (4:3) and Widescreen (16:9) aspect ratios
- PPTX file and for Google Slides
Free fonts used:
- Helvetica (System Font)
- Calibri (System Font)


