The 3-Option Speedometer Gauge Diagram is a three-level measurement template designed for tracking multiple KPIs in PowerPoint and Google Slides.
Compare Multiple KPIs with Clear Three-Level Gauges
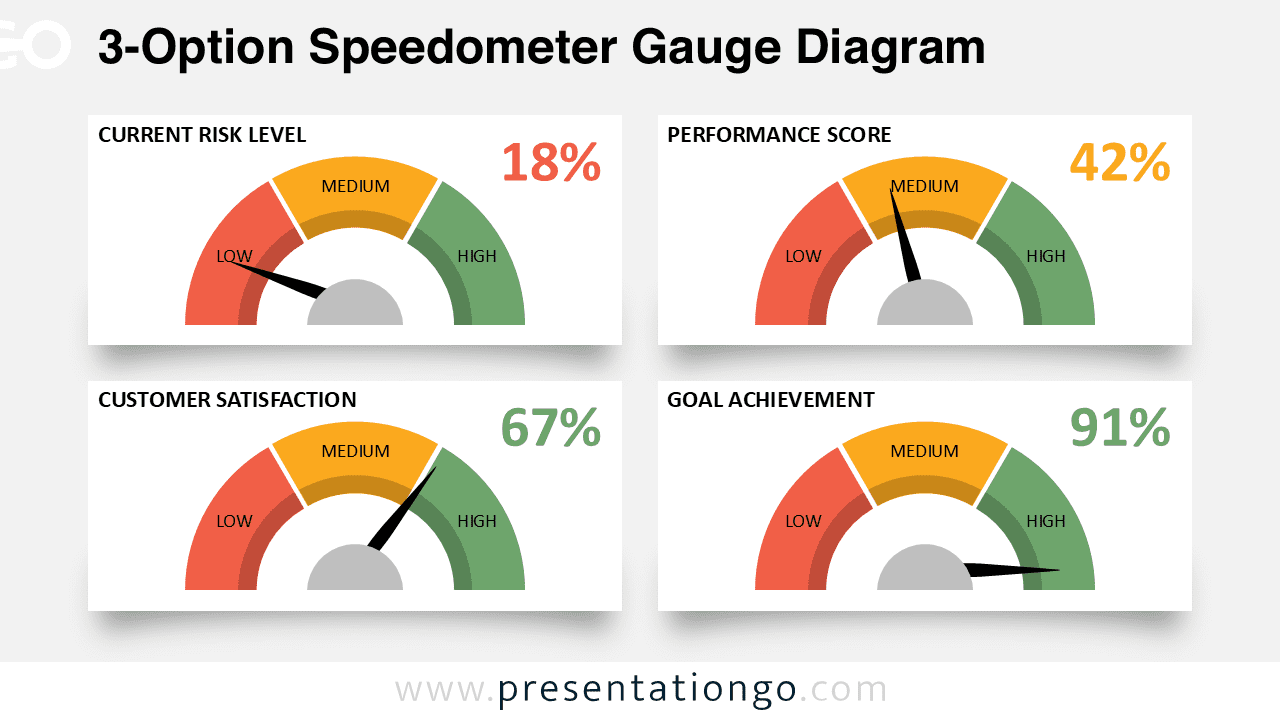
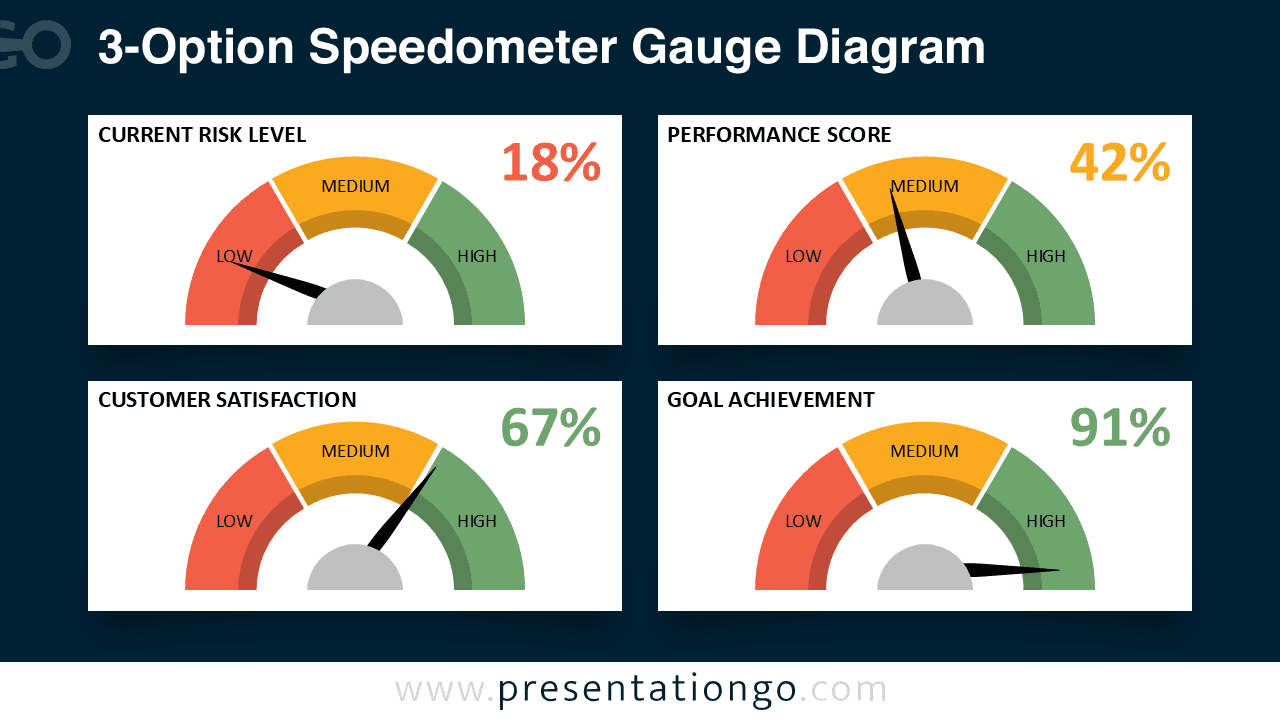
This dashboard-style template arranges four speedometer diagrams in a balanced 2×2 grid, each divided into three equal arc sections labeled Low, Medium, and High. A central pivot needle points to the relevant range, while large percentage figures stand out beside each gauge. The consistent layout and proportional design across all diagrams make comparisons straightforward and easy to grasp.
Speedometer gauge charts are widely used to illustrate progress, performance, or capacity in a visually intuitive way. This template allows you to present four KPIs side by side for a quick assessment of multiple areas. For example, you can compare customer satisfaction, risk exposure, and project performance within one cohesive slide. Executives and managers can rely on this format for dashboards, quarterly reviews, or performance updates.
The template contains two unique slides pre-filled with placeholders that you can easily replace with your own labels and values. Every element is fully customizable, including shapes and colors, so you can match your brand guidelines. It also provides both light and dark background themes and is available in Standard (4:3) and Widescreen (16:9) formats. Compatibility is ensured for both PowerPoint (PPTX) and Google Slides.
Download this 3-option gauge template to communicate performance metrics clearly across four comparable indicators.
Widescreen (16:9) size preview:


This template offers:
- 2 unique slides
- Options for both light and dark themes
- Pre-populated with text placeholders
- Fully customizable shapes for complete control
- Available in both Standard (4:3) and Widescreen (16:9) ratios
- Offered in both PowerPoint PPTX and Google Slides formats
The complete Speedometer Gauge Diagram collection: