The 5-Option Speedometer Gauge Diagram provides a five-level performance measurement system for tracking metrics across multiple categories, designed for PowerPoint and Google Slides.
Compare Multiple KPIs with a Clear Gauge Dashboard
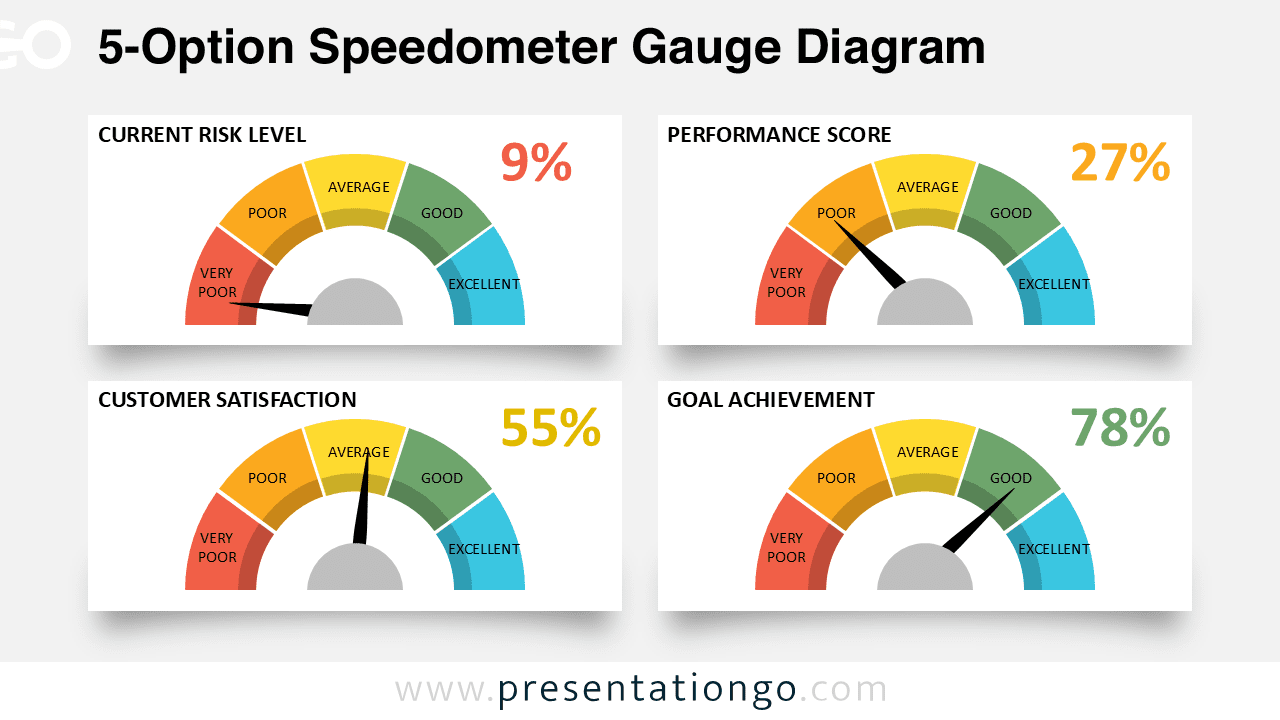
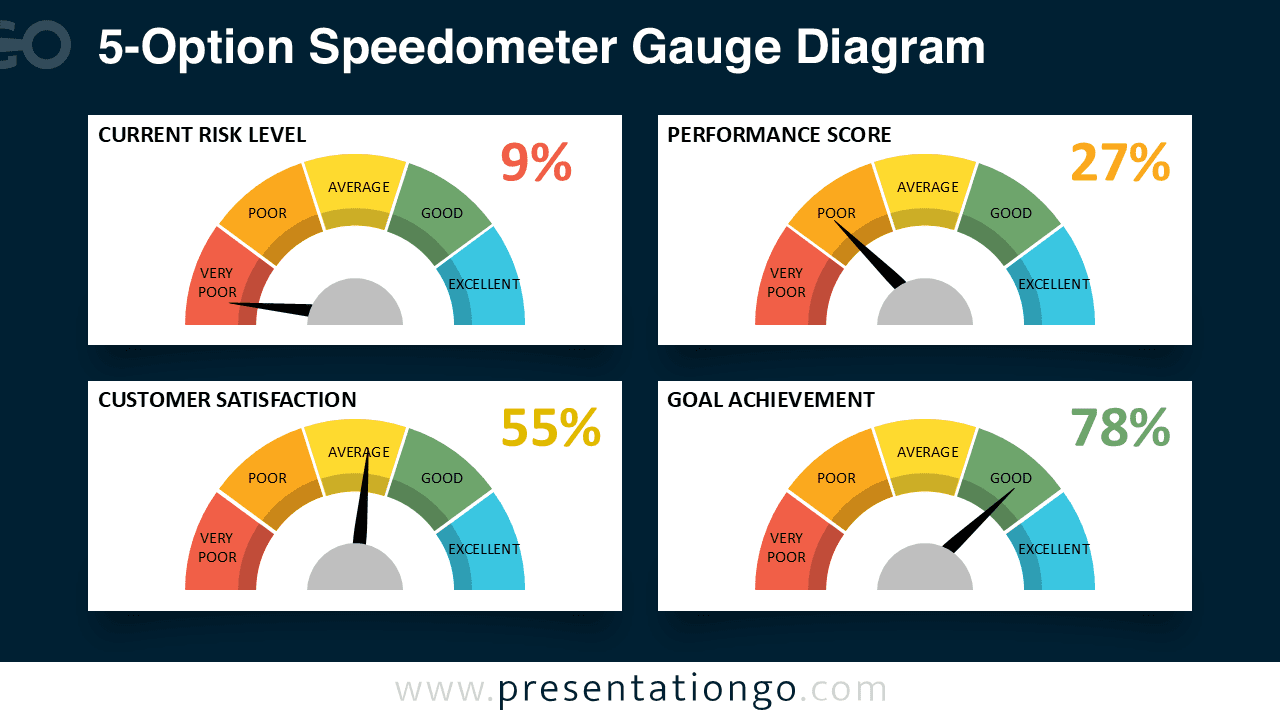
This template features four speedometer gauges arranged in a 2×2 dashboard configuration. Each gauge displays five distinct performance categories—Very Poor, Poor, Average, Good, and Excellent—represented by color-coded arcs. A black needle indicator points to the current performance level, while prominent percentage values appear beside each gauge for quick reference. The color progression moves from red (Very Poor) through orange and yellow to green and blue (Excellent), creating an intuitive visual hierarchy. Each gauge includes a descriptive header such as “Current Risk Level,” “Performance Score,” “Customer Satisfaction,” or “Goal Achievement,” making the dashboard immediately understandable.
Speedometer gauge diagrams translate numerical data into familiar visual formats that audiences can quickly interpret. These charts work particularly well for presenting performance metrics, satisfaction scores, risk assessments, and progress tracking. This specific template allows presenters to display multiple KPIs simultaneously, enabling direct comparisons across different metrics. For instance, a project manager could showcase team performance, budget utilization, timeline adherence, and stakeholder satisfaction on a single slide. Similarly, HR professionals might present employee engagement, retention rates, training completion, and productivity scores. The five-level scale provides enough granularity to capture meaningful performance distinctions without overwhelming viewers with excessive categories.
The template includes 2 unique slides with pre-populated text placeholders that you can customize to match your specific metrics. All shapes are fully editable, allowing you to adjust colors, sizes, and labels according to your presentation needs. Both light and dark theme options are included to suit different presentation environments and brand guidelines. The template is available in Standard (4:3) and Widescreen (16:9) formats, ensuring compatibility with various display setups. Additionally, the design works seamlessly with both PowerPoint PPTX and Google Slides, providing flexibility across platforms.
Download this 5-Option Speedometer Gauge Diagram template to create professional multi-metric dashboards that communicate performance data clearly and effectively.
Widescreen (16:9) size preview:


This template offers:
- 2 unique slides
- Options for both light and dark themes
- Pre-populated with text placeholders
- Fully customizable shapes for complete control
- Available in both Standard (4:3) and Widescreen (16:9) ratios
- Offered in both PowerPoint PPTX and Google Slides formats
The complete Speedometer Gauge Diagram collection: