The Segmented Scale Dashboard provides a creative three-step gauge diagram designed for PowerPoint and Google Slides to visually showcase progress and performance.
Three-Gauge Dashboard for Performance Tracking
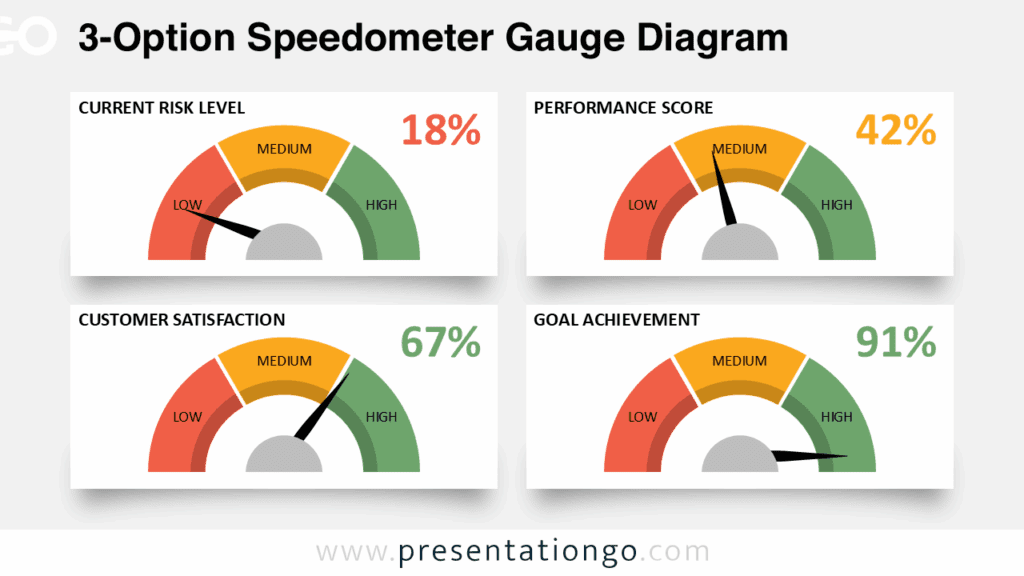
This design includes three gauges, each composed of a semi-circular arrangement of ten pill-shaped segments, a needle that can be customized to point to any level, and a text placeholder for headlines and descriptions. The clean and flexible structure ensures that users can represent their data in a straightforward, visual manner.
Dashboards like these are ideal for representing performance metrics, tracking goals, or comparing key performance indicators in business and academic settings. For example, a sales manager can visually depict monthly target achievements, while a teacher might use it to illustrate student progress in different subjects. By offering a clear visual cue, this dashboard is an effective alternative to numerical tables for presentations requiring a non-data-driven approach.
The template includes two unique slides pre-populated with text placeholders, fully customizable shapes, and non-data-driven pie charts. It offers both light and dark theme options and comes in Standard (4:3) and Widescreen (16:9) formats. Compatible with PowerPoint PPTX and Google Slides, it provides users with versatile customization options.
Download this three-part Segmented Scale Dashboard to easily illustrate progress and performance with flexible, customizable visuals for presentations.
Widescreen (16:9) size preview:

")
This template offers:
- 2 unique slides
- Options for both light and dark themes
- Pre-populated with text placeholders
- Fully customizable shapes for complete control
- Available in both Standard (4:3) and Widescreen (16:9) ratios
- Offered in both PowerPoint PPTX and Google Slides formats