
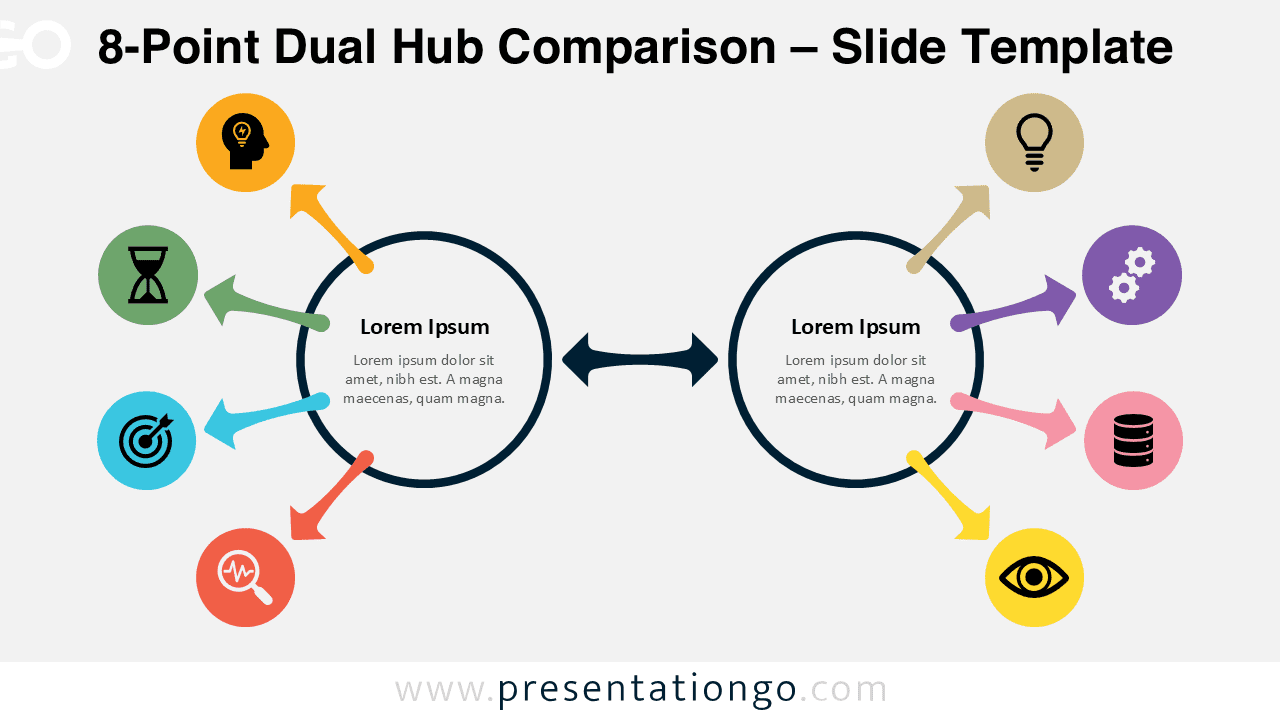
The 8-Point Dual Hub Comparison diagram is designed to help you present more detailed relationships between two central concepts. Built for PowerPoint and Google Slides, this layout provides a structured and visually balanced way to communicate complex information.
Diagram Preview


Features and Customization Options
- Fully editable shapes and text elements
- Includes eight connected points for detailed comparisons
- Two central hubs to emphasize key concepts or entities
- Uses icons from the Office icon library for consistency
- Icons are easy to change directly within PowerPoint or Google Slides
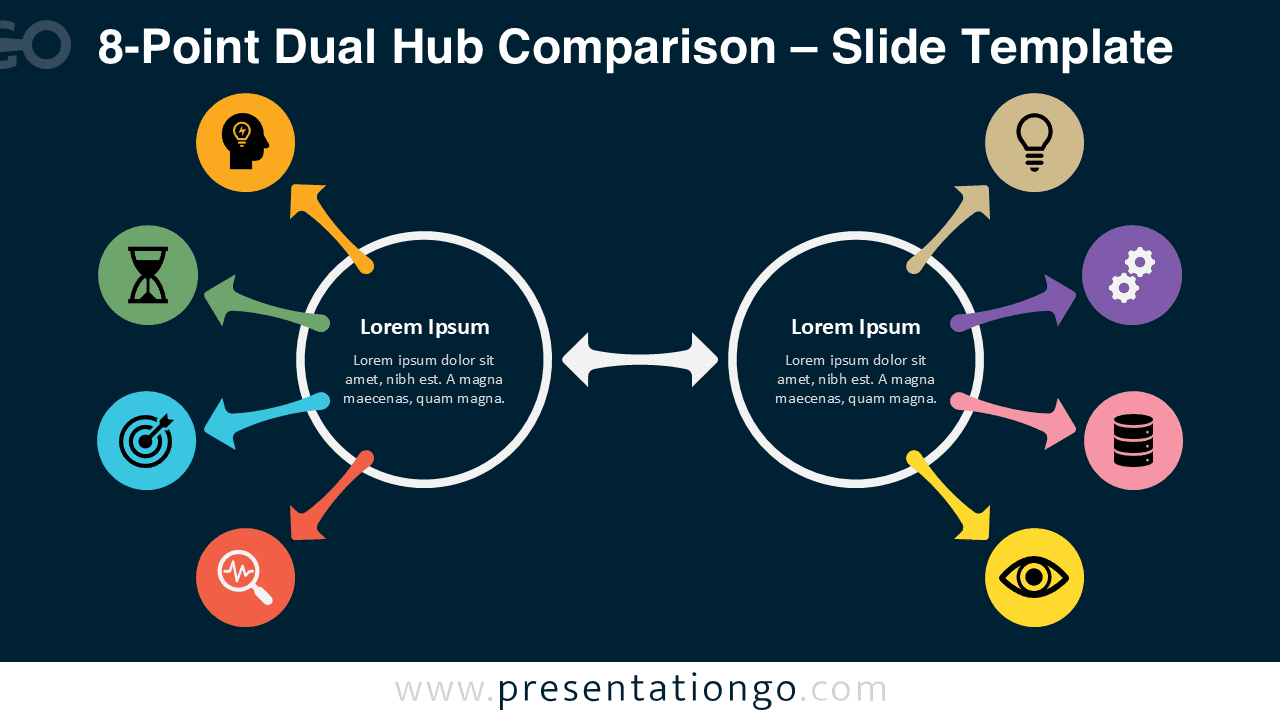
- Available in light and dark background versions
- Compatible with PowerPoint and Google Slides
Design and Structure
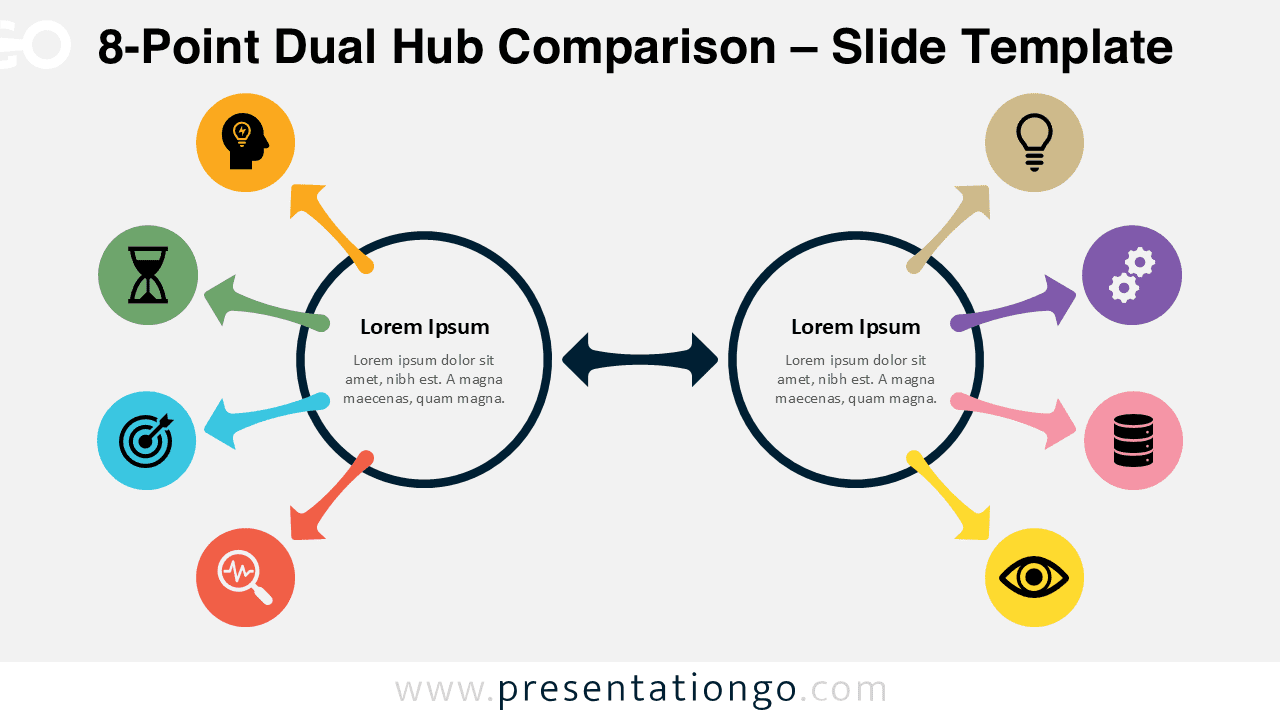
This diagram features two central circular hubs connected by a bidirectional arrow, symbolizing interaction or comparison. Each hub connects to four surrounding points, creating a total of eight elements. Each point includes a colored node with an icon placeholder, helping you visually organize and differentiate information.
The radial structure ensures a balanced composition while allowing you to present more content than simpler layouts. The use of distinct colors enhances readability and supports quick understanding. This makes the diagram ideal for presenting layered concepts or more detailed comparisons.
Practical Applications
- Comparing two detailed business strategies
- Explaining multi-step workflows or systems
- Presenting input-output relationships with more variables
- Mapping interactions between departments or components
- Visualizing structured frameworks with multiple elements
Summary
The 8-Point Dual Hub Comparison diagram offers a flexible and visually engaging solution for presenting more complex ideas. Its structured layout and editable elements allow you to adapt it to a wide range of professional and educational uses. Use it to deliver clear, impactful, and well-organized presentations.



