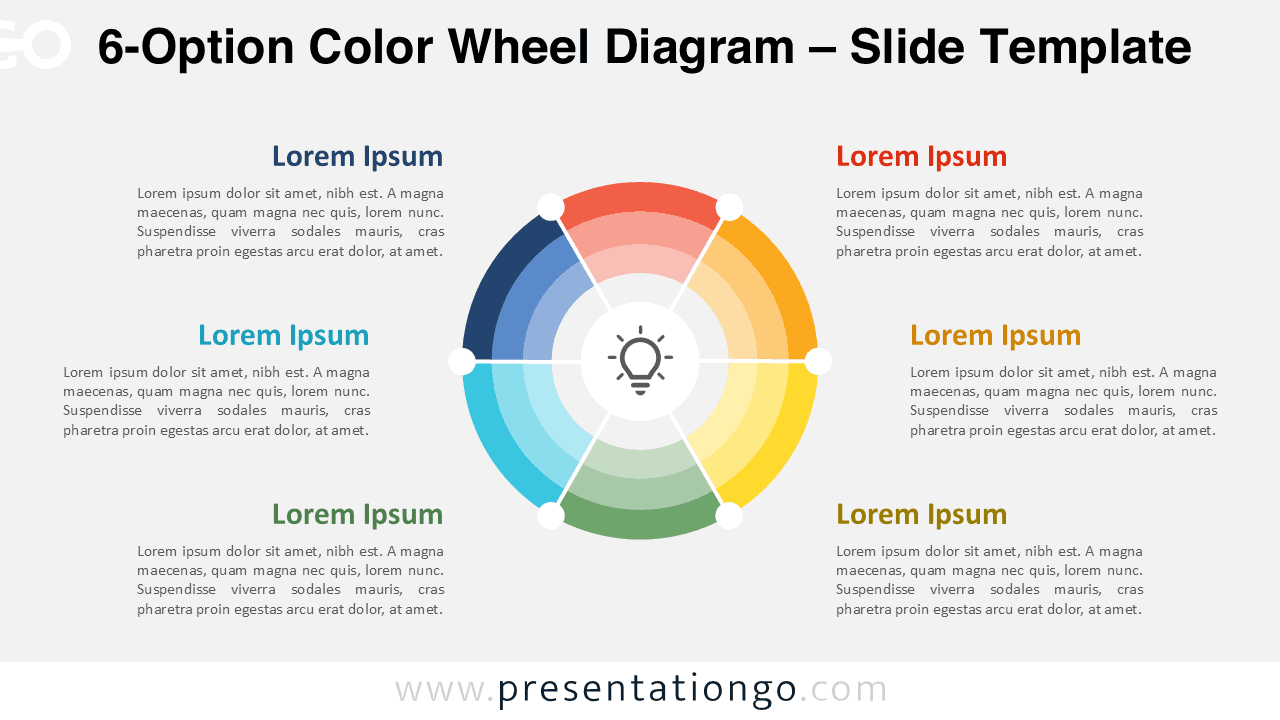
The 6-Option Color Wheel Diagram displays six ideas, stages, or categories linked around a central concept. Its circular design symbolizes flow, connection, and balance. Available for PowerPoint and Google Slides.
Template Preview


Features & Customization
- Editable radial diagram with six segments
- Central idea highlighted with an icon
- Adjust all colors, text, and shapes easily
- Optimized for PowerPoint and Google Slides
- Consistent, polished design suitable for any audience
Design Overview
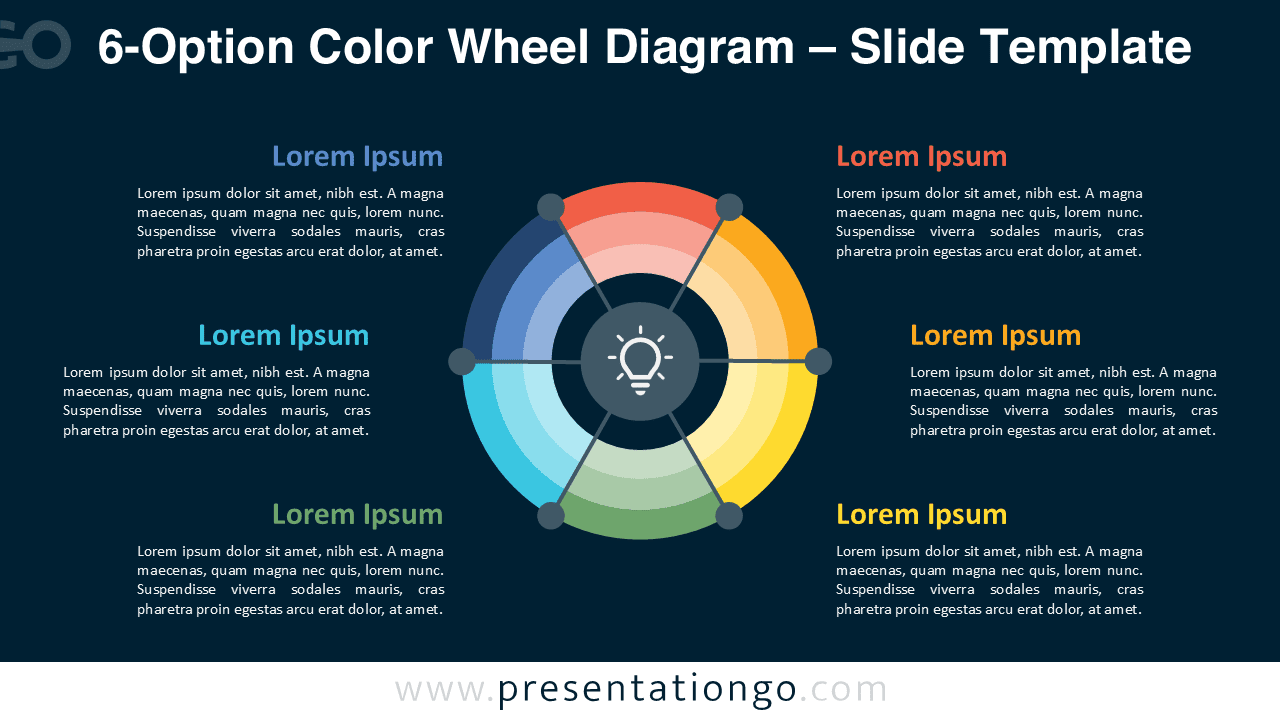
Six equal sections form a vibrant circular pattern, surrounding a central hub. Each colored slice corresponds to a specific step, making it simple to follow progression or relationships. Soft shading and even spacing create visual clarity and rhythm.
This design works for continuous improvement models, business frameworks, or educational cycles. Its symmetry and gradient tones make it both functional and visually appealing.
Practical Applications
- Six-step frameworks, cycles, or processes
- Balanced models or stakeholder relationships
- Strategic, marketing, or project visualizations
How to Edit
- Open in PowerPoint or Google Slides.
- Edit text placeholders for each segment.
- Modify colors to fit your brand palette.
- Update or replace the center icon if needed.
Summary
A professional six-segment wheel that helps you present complex systems simply. Perfect for showing interrelated elements in a continuous cycle.
Frequently Asked Questions (FAQ)
Definitely—replace or recolor icons freely.
In PowerPoint, select the icon, right-click, and choose “Change Graphic → From Icons” or “From File” to insert a new one.
In Google Slides, delete the current icon, go to “Insert → Image” or “Insert → Shape → Icons” to add your own symbol.
Resize and recolor it to match your design.