Free infographic diagram with 4 parts for PowerPoint. Colored graphic design with 4 quadrants and with 4 block arcs, or slices. Editable graphics with text and icon placeholders.
Infographic Diagram with 4 Parts
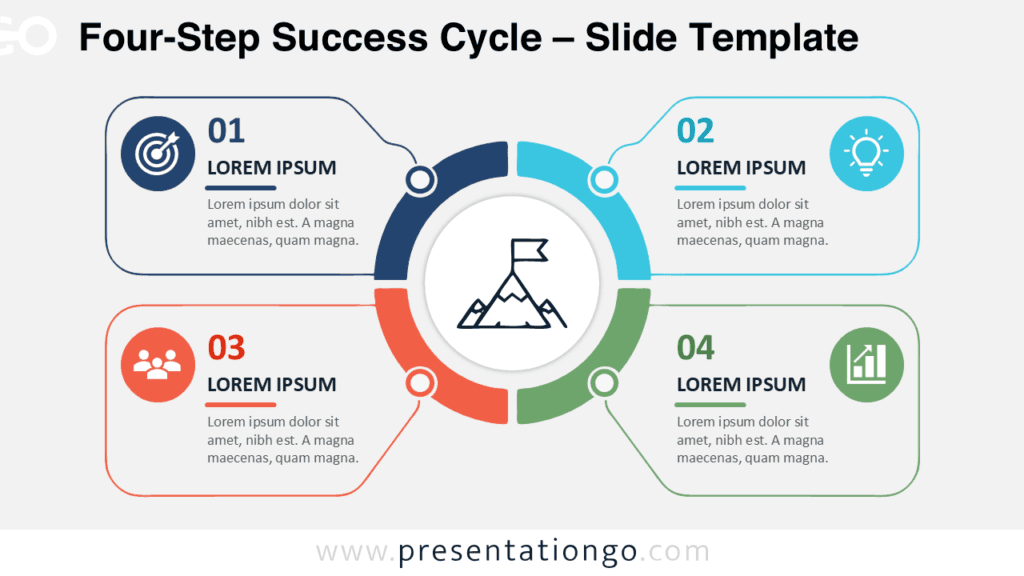
Use this infographic diagram in your presentations:
- to show the relationships of four quadrants to a whole. This four-quadrant matrix diagram is perfect for business or marketing matrices like BCG, SWOT, Ansoff…
- to show how 4 individual parts form a whole.
- to represent a continuing sequence of 4 stages, tasks, or events in a circular flow.
- also to illustrate 4 ideas or concepts.
You can also use this diagram to show the relationship to a central idea: emphasizes both information in the center diagram and how information in the outer shapes contributes to the central idea in a cyclical progression.
Shapes are 100% editable: colors and sizes can be easily changed.
The “Lorem Ipsum” text is for illustrative purposes only. Therefore, you should edit it to fit your own needs. Also, feel free to customize this diagram with your selection of icons (to insert an icon under PowerPoint, go to Insert > Icons…)
Includes 2 slide option designs: Standard (4:3) and Widescreen (16:9).
Widescreen (16:9) size preview:


This ‘Infographic Diagram with 4 Parts for PowerPoint’ features:
- 2 unique slides
- Light layout
- Ready to use template with icons and text placeholders
- Completely editable shapes
- Uses a selection of PowerPoint editable icons
- Standard (4:3) and Widescreen (16:9) aspect ratios
- PPTX file (PowerPoint)
Free fonts used:
- Helvetica (System Font)
- Calibri (System Font)


Comments are closed.