The Analytics Pulse Template is a professional and visually compelling presentation set designed for PowerPoint and Google Slides. Featuring glowing financial graphs and structured layouts, it’s ideal for showcasing metrics, performance reviews, or forecasts.
A Visual Language of Innovation and Connectivity
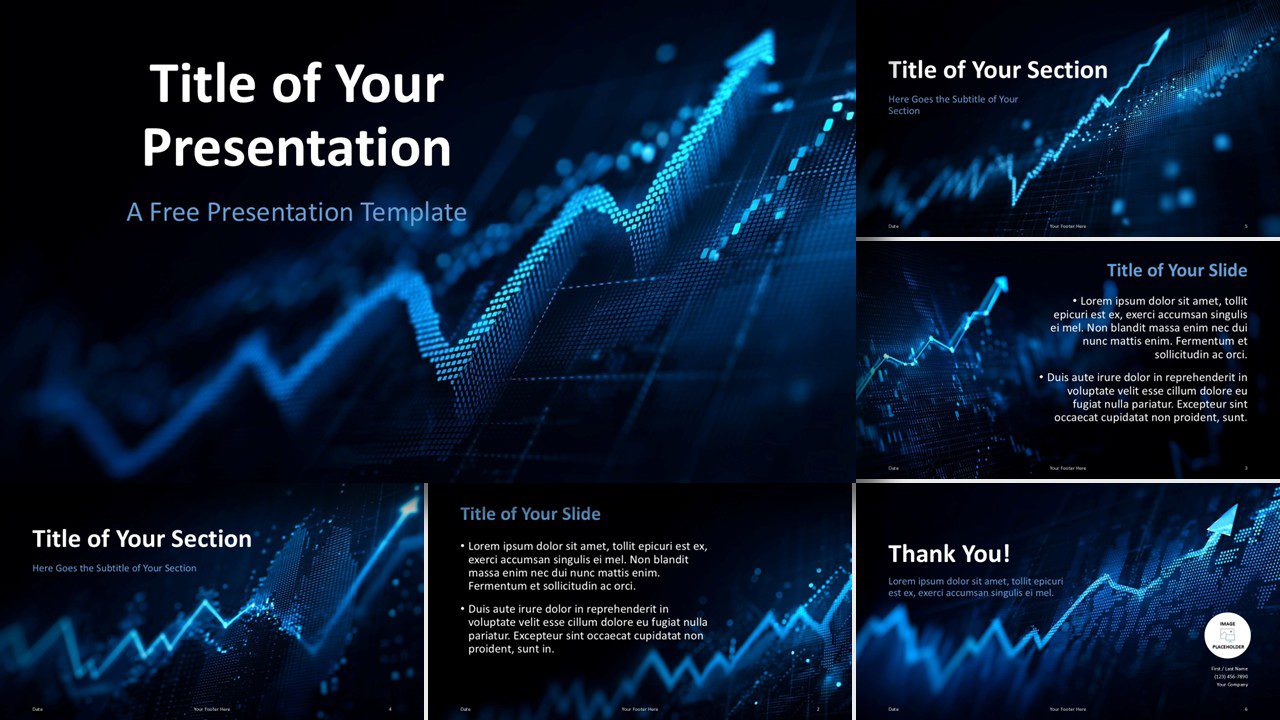
The Analytics Pulse Template features a sophisticated navy and black color palette accented with vibrant neon blue elements. Additionally, each slide showcases glowing financial graphs with ascending peaks that create a forward-looking, analytical atmosphere. The design maintains high contrast between dark backgrounds and bright text, ensuring optimal readability. Moreover, clean typography and streamlined layouts emphasize data clarity while maintaining professional appeal. This tech-forward aesthetic perfectly balances modern sophistication with practical usability.
The Analytics Pulse Template is especially useful in finance, marketing, and tech contexts. For instance, data analysts can use it for quarterly review decks. Startups may leverage it for investor pitch meetings, while marketing teams might present campaign metrics during webinars or internal briefings. Its structure and tone work well across both in-person and virtual settings.
The template includes six fully editable slides. The title slide grabs attention with a glowing upward-trend graph. Two content slides—left-aligned and centered—help structure main ideas and findings. Section divider slides mark topic transitions with consistent graph visuals, maintaining flow and professionalism. The thank-you slide wraps up with a bold message and space for contact info or branding. All text areas are customizable, ensuring the template adapts to your specific data and storytelling style.
Designed with clarity and consistency in mind, this layout supports confident, results-driven communication. Use the Analytics Pulse Template to present insights with both visual impact and analytical precision.
Preview of the template:


This template offers:
- 6 slides, plus a color palette slide.
- Easy editing with Slide Master.
- Text and picture placeholders included.
- Widescreen format.
- For PowerPoint and Google Slides.
Free font used:
- Calibri