Skip to content
PresentationGO
  • Explore
    • Templates
      • Abstract
      • Sports
      • Business
      • Religion & Holidays
      • Nature
      • Technology
      • Professions
      • Flat Lays & Scenes
      • Health & Recreation
      • Color Palettes
      • Education
      • Food & Drink
      • Science
      • CertificatesNEW
      • All Templates
    • Charts & Diagrams
      • Processes
        • Circular
        • Linear
        • Alternating
        • Stairs
        • Bending
      • Funnels
      • Pyramids
      • Matrix Charts
      • Business Models
      • Non-Data-Driven Chart Alternatives
      • Radial Diagrams
      • Flow Charts
      • Data-Driven Charts & Graphs
      • Organizational Charts
      • Clusters & Relationships
      • Venn Diagrams
      • All Charts & Diagrams
    • Text & Tables
      • Text Boxes
      • Comparisons
      • Paper & Banners
      • Numbered Lists
      • Speaking Bubbles
      • Pricing Tables
      • Bullet Point / Text Layouts
      • Contents & Table of Contents
      • Quotes
      • Word Clouds
      • To-do & Checklists
      • All Text & Tables
    • Timelines & Planning
      • Calendars
      • Timelines
      • Gantt Charts
      • Agenda
      • All Timelines & Planning
    • Graphics & Metaphors
      • Concepts
      • Silhouettes & People
      • Light Bulbs
      • Trees
      • Letters & Numbers
      • Signs
      • Mockups
      • Food
      • Money
      • Road
      • Target and Goals
      • All Graphics & Metaphors
    • Maps & Flags
      • Flag Templates
      • Continent Maps
      • Country Maps
        • Africa
        • Asia
        • Australia / Oceania
        • Europe
        • North America
        • South America
      • World Maps
      • All Maps
    • AI ImagesNEW
  • Search by
    • Colors
      • Black
      • Blue
      • Brown
      • Gray
      • Green
      • Cream
      • Light Blue
      • Orange
      • Pink
      • Purple
      • Gold
      • Red
      • White
      • Yellow
      • Teal
    • Steps (Options)
      • 2 options
      • 3 options
      • 4 options
      • 5 options
      • 6 options
      • 7 options
      • 8 options
      • 9 options
      • 10 options
      • 12 options
  • Templates
  • Charts & Diagrams
  • Text & Tables
  • Timelines & Planning
  • Graphics & Metaphors
  • Maps & Flags
  • AI ImagesNEW

Charts & Diagrams

Transform complex data into clear visuals with our extensive collection of 1,704 Charts & Diagrams templates for PowerPoint and Google Slides. Choose from flowcharts, mind maps, data-driven graphs, organizational charts, and more to engage your audience and enhance your presentations.

Main Charts & Diagrams Categories:ProcessesShapesRadial DiagramsMatrix ChartsGeometric ShapesNon-Data-Driven Chart AlternativesBusiness ModelsData-Driven Charts & GraphsFlow ChartsOrganizational ChartsStagesMulti-Level ChartsVenn DiagramsClusters & RelationshipsTrees
Free 6-Step Puzzle Cycle for PowerPoint and Google Slides
Charts & Diagrams
6 options

6-Step Puzzle Cycle for PowerPoint and Google Slides

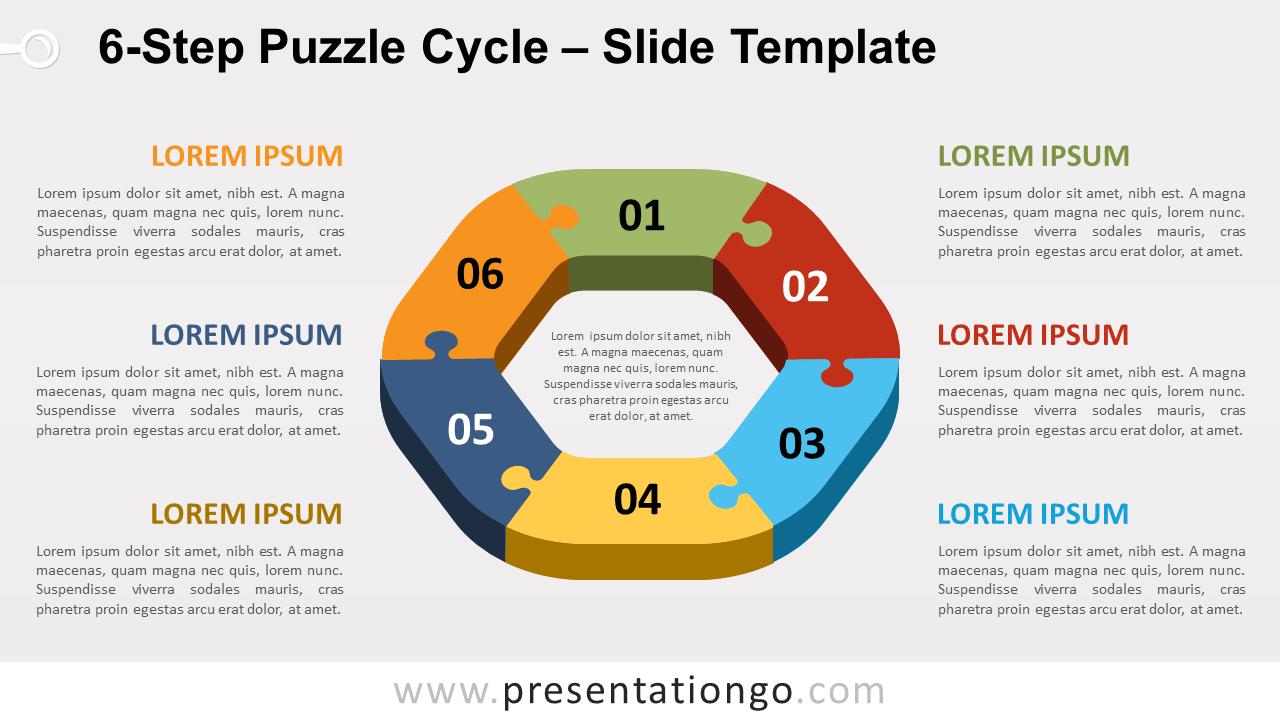
Donut-like hexagonal shape with 6 puzzle pieces, assembled or interlocked in a circular flow.

Google Slides, PPTX

4:316:9

Free 4-Step Twisted Cycle for PowerPoint and Google Slides
Charts & Diagrams
4 options

4-Step Twisted Cycle for PowerPoint and Google Slides

Free cycle diagram with 4 twisted shapes for PowerPoint and Google Slides. 4-step circular diagram.

Google Slides, PPTX

4:316:9

Free 3-Step Twisted Cycle for PowerPoint and Google Slides
Charts & Diagrams
3 options

3-Step Twisted Cycle for PowerPoint and Google Slides

Free cycle diagram with 3 twisted shapes for PowerPoint and Google Slides. 3-step circular diagram.

Google Slides, PPTX

4:316:9

Free Tooth Chart for PowerPoint and Google Slides
Charts & DiagramsGraphics & Metaphors
3 options

Tooth Chart for PowerPoint and Google Slides

Three (3) tooth illustrations with adjustable fill height. Non-data-driven chart alternative.

Google Slides, PPTX

4:316:9

Free Truck Pictorial Chart for PowerPoint and Google Slides
Charts & DiagramsGraphics & Metaphors

Truck Pictorial Chart for PowerPoint and Google Slides

Illustration of three (3) trucks loaded with bars. Non-data-driven chart alternative.

Google Slides, PPTX

4:316:9

Free Converging Cycle for PowerPoint and Google Slides
Charts & Diagrams
4 options

Converging Cycle for PowerPoint and Google Slides

4 curved arrows converging to a circular shape in the center. Great slide to illustrate the relationship to a central idea.

Google Slides, PPTX

4:316:9

Free Cart and Column Chart for PowerPoint
Charts & DiagramsGraphics & Metaphors
Data-driven

Cart and Column Chart for PowerPoint

Data-driven column chart in a shopping cart illustration.

PPTX

4:316:9

Free Crab Diagram for PowerPoint and Google Slides
Charts & Diagrams
8 options

Crab Diagram for PowerPoint and Google Slides

Radial chart with 8 elements connected to a central circle.

Google Slides, PPTX

4:316:9

Free Recycling Diagram for PowerPoint and Google Slides
Charts & DiagramsGraphics & Metaphors
3 options

Recycling Diagram for PowerPoint and Google Slides

Colorful illustration of the universal recycling symbol.

Google Slides, PPTX

4:316:9

Free Projector Screen Matrix for PowerPoint and Google Slides
Charts & Diagrams
4 options

Projector Screen Matrix for PowerPoint and Google Slides

4-quadrant matrix diagram designed in place of the screen of a projector pictogram.

Google Slides, PPTX

4:316:9

Free Shell Diagram for PowerPoint and Google Slides
Charts & Diagrams
5 options

Shell Diagram for PowerPoint and Google Slides

An editable scallop shell used as a semi-circular cycle diagram, with 5 colorful stages.

Google Slides, PPTX

4:316:9

Free Porter's Five Forces Model for PowerPoint and Google Slides
Charts & Diagrams

Porter’s Five Forces Model for PowerPoint and Google Slides

Framework template for assessing and evaluating the competitive strength and position of a business organization.

Google Slides, PPTX

4:316:9

Older posts
Newer posts
← Previous Page1 … Page107 Page108 Page109 … Page142 Next →
Search Templates by categories
Templates Charts & Diagrams Text & Tables Maps & Flags Timelines & Planning Graphics & Metaphors
Search Templates by colors
Support us
icon of a coffee cup for 'support us' - PresentationGo
... buying us a coffee

Love our templates? Show your support with a coffee!

Donate Here

Thank you for fueling our creativity!

Logotype PresentationGo
Content

Templates

Charts & Diagrams

Text & Tables

Graphics & Metaphors

Timelines & Planning

Maps

AI ImagesNEW

Best-Ofs & Tips

Legal

Terms and Conditions

Privacy Statement

Cookie Policy

Digital Millennium Copyright Act (DMCA) Policy

Disclaimer

Help

Contact us

FAQ

Templates

Charts & Diagrams

Text & Tables

Graphics & Metaphors

Timelines & Planning

Maps

Best-Ofs & Tips

Terms and Conditions

Privacy Statement

Cookie Policy

Digital Millennium Copyright Act (DMCA) Policy

Disclaimer

Contact us

FAQ

© Copyright 2026 Ofeex | PRESENTATIONGO® is a registered trademark | All rights reserved.

PresentationGO
Cookies & Privacy

To provide the best experiences, we and our partners use technologies like cookies to store and/or access device information. Consenting to these technologies will allow us and our partners to process personal data such as browsing behavior or unique IDs on this site and show (non-) personalized ads. Not consenting or withdrawing consent, may adversely affect certain features and functions.

Click below to consent to the above or make granular choices. Your choices will be applied to this site only. You can change your settings at any time, including withdrawing your consent, by using the toggles on the Cookie Policy, or by clicking on the manage consent button at the bottom of the screen.

Functional Always active
Needed for the website to work properly.
Preferences
Remember your settings (like language or display choices).
Statistics
The technical storage or access that is used exclusively for statistical purposes. Help us understand how the site is used so we can improve it (Google Analytics).
Marketing
Used to show relevant ads and measure ad performance (Google AdSense and partners).
Statistics

Marketing

Features
Always active

Always active
  • Manage options
  • Manage services
  • Manage {vendor_count} vendors
  • Read more about these purposes
Manage preferences
  • {title}
  • {title}
  • {title}
PresentationGO
Cookies & Privacy

We use cookies to run the site, measure traffic, and show ads that help keep our downloads free. Manage your choices anytime.

Functional Always active
Needed for the website to work properly.
Preferences
Remember your settings (like language or display choices).
Statistics
The technical storage or access that is used exclusively for statistical purposes. Help us understand how the site is used so we can improve it (Google Analytics).
Marketing
Used to show relevant ads and measure ad performance (Google AdSense and partners).
Statistics

Marketing

Features
Always active

Always active
  • Manage options
  • Manage services
  • Manage {vendor_count} vendors
  • Read more about these purposes
Manage preferences
  • {title}
  • {title}
  • {title}

Thank you for downloading from PresentationGO!

AI Images are free to use with no attribution required (though appreciated).

Presentation templates are also free, but require attribution.
For example, you can include this credit somewhere visible:

If you enjoy our free resources and want to support us, you can:

Buy us a coffee

Thank you for your continued support!