Skip to content
PresentationGO
  • Explore
    • Templates
      • Abstract
      • Sports
      • Business
      • Religion & Holidays
      • Nature
      • Technology
      • Professions
      • Flat Lays & Scenes
      • Health & Recreation
      • Color Palettes
      • Education
      • Food & Drink
      • Science
      • CertificatesNEW
      • All Templates
    • Charts & Diagrams
      • Processes
        • Circular
        • Linear
        • Alternating
        • Stairs
        • Bending
      • Funnels
      • Pyramids
      • Matrix Charts
      • Business Models
      • Non-Data-Driven Chart Alternatives
      • Radial Diagrams
      • Flow Charts
      • Data-Driven Charts & Graphs
      • Organizational Charts
      • Clusters & Relationships
      • Venn Diagrams
      • All Charts & Diagrams
    • Text & Tables
      • Text Boxes
      • Comparisons
      • Paper & Banners
      • Numbered Lists
      • Speaking Bubbles
      • Pricing Tables
      • Bullet Point / Text Layouts
      • Contents & Table of Contents
      • Quotes
      • Word Clouds
      • To-do & Checklists
      • All Text & Tables
    • Timelines & Planning
      • Calendars
      • Timelines
      • Gantt Charts
      • Agenda
      • All Timelines & Planning
    • Graphics & Metaphors
      • Concepts
      • Silhouettes & People
      • Light Bulbs
      • Trees
      • Letters & Numbers
      • Signs
      • Mockups
      • Food
      • Money
      • Road
      • Target and Goals
      • All Graphics & Metaphors
    • Maps & Flags
      • Flag Templates
      • Continent Maps
      • Country Maps
        • Africa
        • Asia
        • Australia / Oceania
        • Europe
        • North America
        • South America
      • World Maps
      • All Maps
    • AI ImagesNEW
  • Search by
    • Colors
      • Black
      • Blue
      • Brown
      • Gray
      • Green
      • Cream
      • Light Blue
      • Orange
      • Pink
      • Purple
      • Gold
      • Red
      • White
      • Yellow
      • Teal
    • Steps (Options)
      • 2 options
      • 3 options
      • 4 options
      • 5 options
      • 6 options
      • 7 options
      • 8 options
      • 9 options
      • 10 options
      • 12 options
  • Templates
  • Charts & Diagrams
  • Text & Tables
  • Timelines & Planning
  • Graphics & Metaphors
  • Maps & Flags
  • AI ImagesNEW

Charts & Diagrams

Transform complex data into clear visuals with our extensive collection of 1,704 Charts & Diagrams templates for PowerPoint and Google Slides. Choose from flowcharts, mind maps, data-driven graphs, organizational charts, and more to engage your audience and enhance your presentations.

Main Charts & Diagrams Categories:ProcessesShapesRadial DiagramsMatrix ChartsGeometric ShapesNon-Data-Driven Chart AlternativesBusiness ModelsData-Driven Charts & GraphsFlow ChartsOrganizational ChartsStagesMulti-Level ChartsVenn DiagramsClusters & RelationshipsTrees
Three level funnel diagram for PowerPoint with colorful stacked sections and green curved arrows showing conversion flow
Charts & Diagrams
3 options

3 level PowerPoint Funnel With Green Arrows

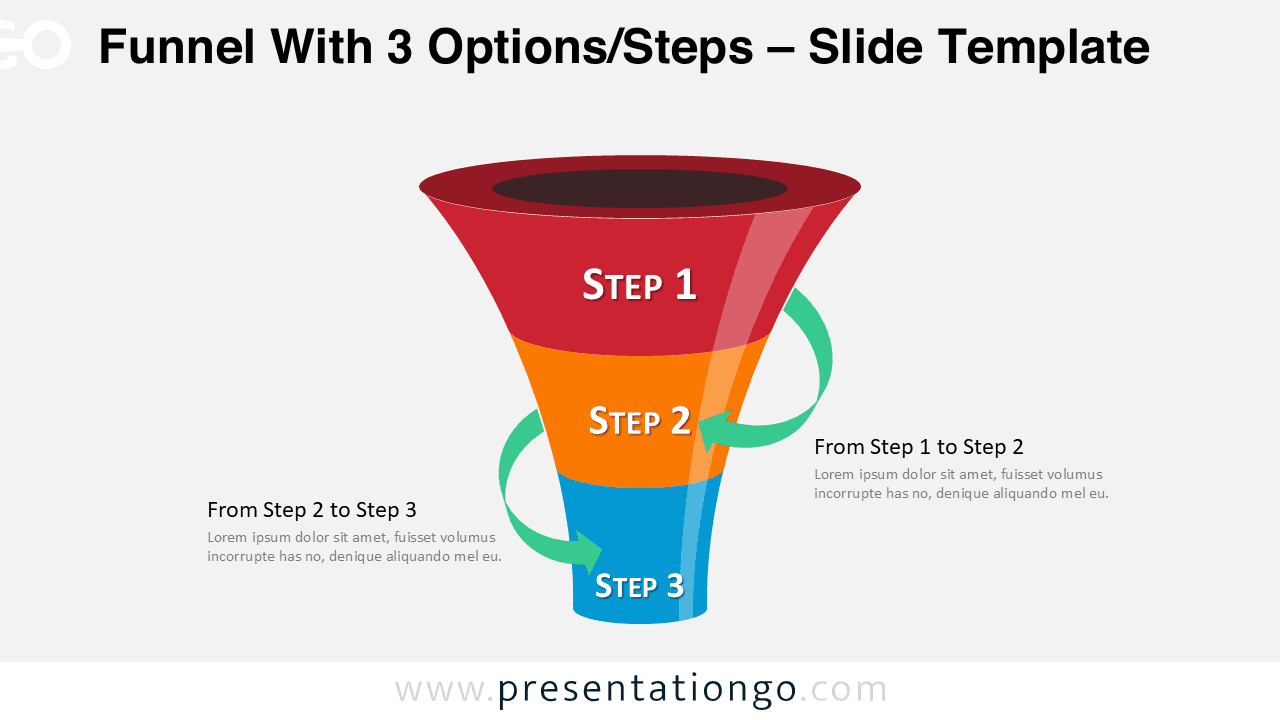
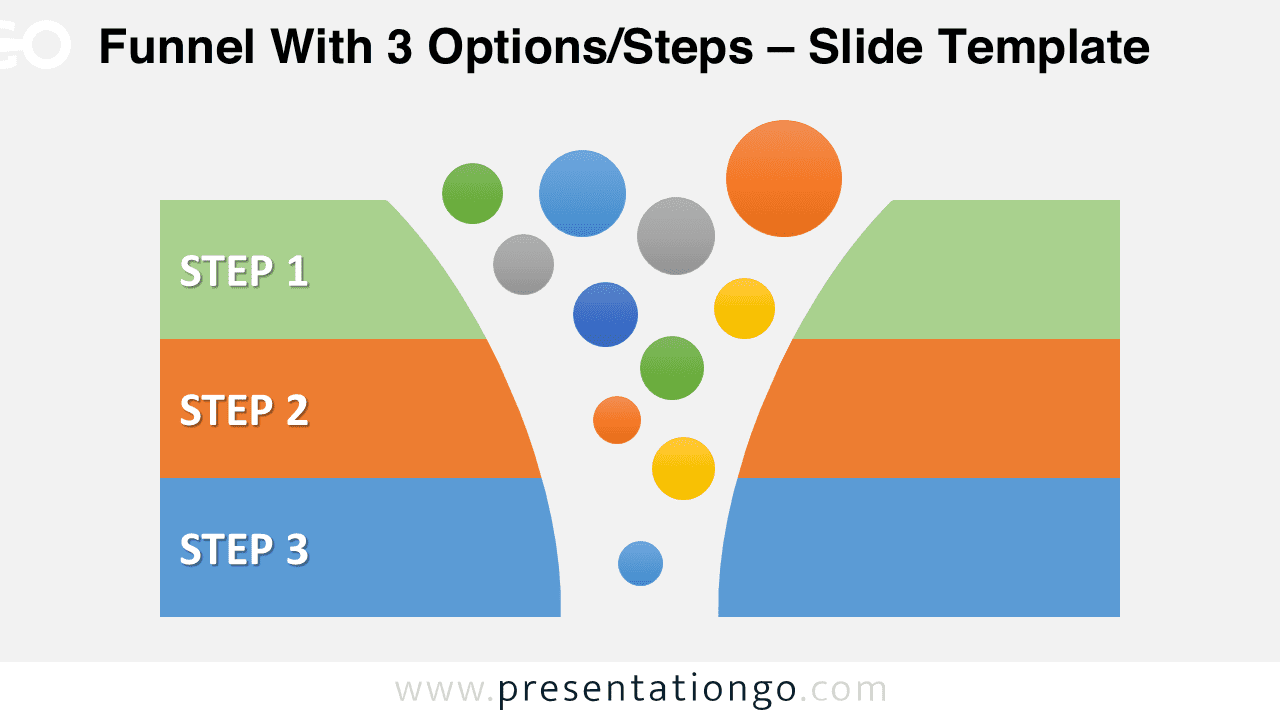
Free editable PowerPoint funnel made of 3 levels, and with green curved arrows to indicate each conversion phase. Colorful, editable shapes. Ready to use.

PPTX

4:316:9

Four level funnel diagram for PowerPoint with colorful stacked sections and green curved arrows showing conversion stages
Charts & Diagrams
4 options

4 level PowerPoint Funnel With Green Arrows

Free editable PowerPoint funnel made of 4 levels, and with green curved arrows to indicate each conversion phase. Colorful, editable shapes. Ready to use.

PPTX

4:316:9

Five level funnel diagram for PowerPoint with colorful stacked sections and green curved arrows showing conversion steps
Charts & Diagrams
5 options

5 level PowerPoint Funnel With Green Arrows

Free editable PowerPoint funnel made of 5 levels, and with green curved arrows to indicate each conversion phase. Colorful, editable shapes. Ready to use.

PPTX

4:316:9

Colorful funnel diagram for PowerPoint with bubbles flowing into curved cone and side text placeholders for process steps or ideas
Charts & Diagrams

Funnel for PowerPoint with Bubbles

Free funnel for PowerPoint with Bubbles. A funnel diagram with cool bubbles and bright colors to entertain and enlighten your audience.

PPTX

4:316:9

Two stage funnel graphics for PowerPoint with colorful bubbles flowing into curved funnel and horizontal banners for each step
Charts & Diagrams
2 options

2 Stage Funnel Graphics for PowerPoint

Free funnel graphics for PowerPoint with 2 stages with outside horizontal banners. Colorful editable elements. Use this funnel in your presentation as a metaphor to help visualize the conversion from broadest to most narrow.

PPTX

4:316:9

Three stage funnel graphics for PowerPoint with colorful bubbles entering curved funnel and horizontal banners for each step
Charts & Diagrams
3 options

3-Stage Funnel Graphics for PowerPoint

Free 3-stage funnel for PowerPoint. A funnel diagram with 3 outer horizontal layers or banners. Completely editable graphics.

PPTX

4:316:9

Four stage funnel graphics for PowerPoint with colorful bubbles flowing into curved funnel and horizontal banners for each step
Charts & Diagrams
4 options

4 Stage Funnel Graphics for PowerPoint

Free funnel graphics for PowerPoint with 4 stages with outside horizontal banners. Colorful editable elements. Use this funnel in your presentation as a metaphor to help visualize the conversion from broadest to most narrow.

PPTX

4:316:9

Five stage funnel graphics for PowerPoint with colorful bubbles flowing into curved funnel and horizontal banners for each step
Charts & Diagrams
5 options

5 Stage Funnel Graphics for PowerPoint

Free funnel graphics for PowerPoint with 5 stages with outside horizontal banners. Colorful editable elements. Use this funnel in your presentation as a metaphor to help visualize the conversion from broadest to most narrow.

PPTX

4:316:9

Free editable curved gray funnel diagram for PowerPoint with two levels and horizontal gray banners for each stage
Charts & Diagrams
2 options

2 level gray funnel diagram for PowerPoint

Free editable curved PowerPoint funnel diagram. 2 level gray funnel. Horizontal with variations of gray banners to indicate each level.

PPTX

4:316:9

Free editable curved gray funnel diagram for PowerPoint with three levels and horizontal gray banners for each stage
Charts & Diagrams
3 options

3 level gray funnel diagram for PowerPoint

Free editable curved PowerPoint funnel diagram. 3 level gray funnel. Horizontal with variations of gray banners to indicate each level.

PPTX

4:316:9

Free editable curved gray funnel diagram for PowerPoint with four levels and horizontal gray banners for each stage
Charts & Diagrams
4 options

4 level gray funnel diagram for PowerPoint

Free editable curved PowerPoint funnel diagram. 4 level gray funnel. Horizontal with variations of gray banners to indicate each level.

PPTX

4:316:9

Free editable curved gray funnel diagram for PowerPoint with five levels and horizontal gray banners representing stages
Charts & Diagrams
5 options

5 level gray funnel diagram for PowerPoint

Free editable curved PowerPoint funnel diagram. 5 level gray funnel. Horizontal with variations of gray banners to indicate each level.

PPTX

4:316:9

Older posts
Newer posts
← Previous Page1 … Page139 Page140 Page141 Page142 Next →
Search Templates by categories
Templates Charts & Diagrams Text & Tables Maps & Flags Timelines & Planning Graphics & Metaphors
Search Templates by colors
Support us
icon of a coffee cup for 'support us' - PresentationGo
... buying us a coffee

Love our templates? Show your support with a coffee!

Donate Here

Thank you for fueling our creativity!

Logotype PresentationGo
Content

Templates

Charts & Diagrams

Text & Tables

Graphics & Metaphors

Timelines & Planning

Maps

AI ImagesNEW

Best-Ofs & Tips

Legal

Terms and Conditions

Privacy Statement

Cookie Policy

Digital Millennium Copyright Act (DMCA) Policy

Disclaimer

Help

Contact us

FAQ

Templates

Charts & Diagrams

Text & Tables

Graphics & Metaphors

Timelines & Planning

Maps

Best-Ofs & Tips

Terms and Conditions

Privacy Statement

Cookie Policy

Digital Millennium Copyright Act (DMCA) Policy

Disclaimer

Contact us

FAQ

© Copyright 2026 Ofeex | PRESENTATIONGO® is a registered trademark | All rights reserved.

PresentationGO
Cookies & Privacy

To provide the best experiences, we and our partners use technologies like cookies to store and/or access device information. Consenting to these technologies will allow us and our partners to process personal data such as browsing behavior or unique IDs on this site and show (non-) personalized ads. Not consenting or withdrawing consent, may adversely affect certain features and functions.

Click below to consent to the above or make granular choices. Your choices will be applied to this site only. You can change your settings at any time, including withdrawing your consent, by using the toggles on the Cookie Policy, or by clicking on the manage consent button at the bottom of the screen.

Functional Always active
Needed for the website to work properly.
Preferences
Remember your settings (like language or display choices).
Statistics
The technical storage or access that is used exclusively for statistical purposes. Help us understand how the site is used so we can improve it (Google Analytics).
Marketing
Used to show relevant ads and measure ad performance (Google AdSense and partners).
Statistics

Marketing

Features
Always active

Always active
  • Manage options
  • Manage services
  • Manage {vendor_count} vendors
  • Read more about these purposes
Manage preferences
  • {title}
  • {title}
  • {title}
PresentationGO
Cookies & Privacy

We use cookies to run the site, measure traffic, and show ads that help keep our downloads free. Manage your choices anytime.

Functional Always active
Needed for the website to work properly.
Preferences
Remember your settings (like language or display choices).
Statistics
The technical storage or access that is used exclusively for statistical purposes. Help us understand how the site is used so we can improve it (Google Analytics).
Marketing
Used to show relevant ads and measure ad performance (Google AdSense and partners).
Statistics

Marketing

Features
Always active

Always active
  • Manage options
  • Manage services
  • Manage {vendor_count} vendors
  • Read more about these purposes
Manage preferences
  • {title}
  • {title}
  • {title}

Thank you for downloading from PresentationGO!

AI Images are free to use with no attribution required (though appreciated).

Presentation templates are also free, but require attribution.
For example, you can include this credit somewhere visible:

If you enjoy our free resources and want to support us, you can:

Buy us a coffee

Thank you for your continued support!