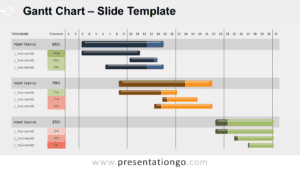
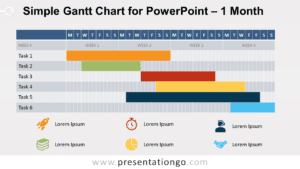
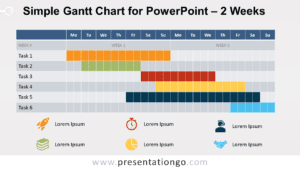
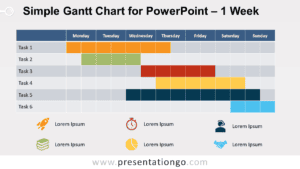
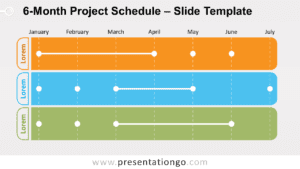
The Gantt Chart for PowerPoint provides a structured monthly view for planning and tracking project tasks. Seven task rows align with a daily timeline, while horizontal bars show when each activity begins and how long it runs. The layout works well for project schedules, deadlines, milestones, work plans, and delivery tracking.
Diagram Preview

Features and Customization Options
- Includes 16:9 and 4:3 versions for Microsoft PowerPoint
- Includes 2 editable slides with matching layouts
- Editable Gantt bars — drag to reschedule
- Editable task names, dates, and labels
- Editable timeline with adjustable dates
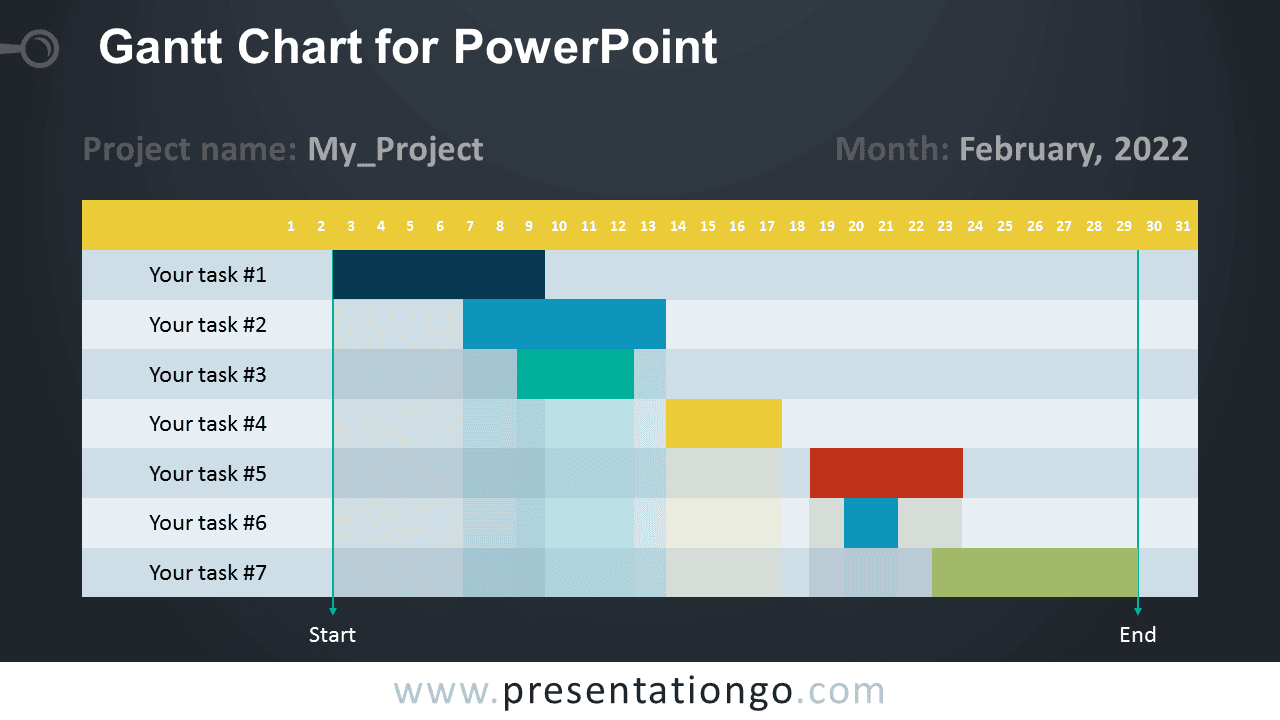
- Includes both light and dark background versions
Design and Structure
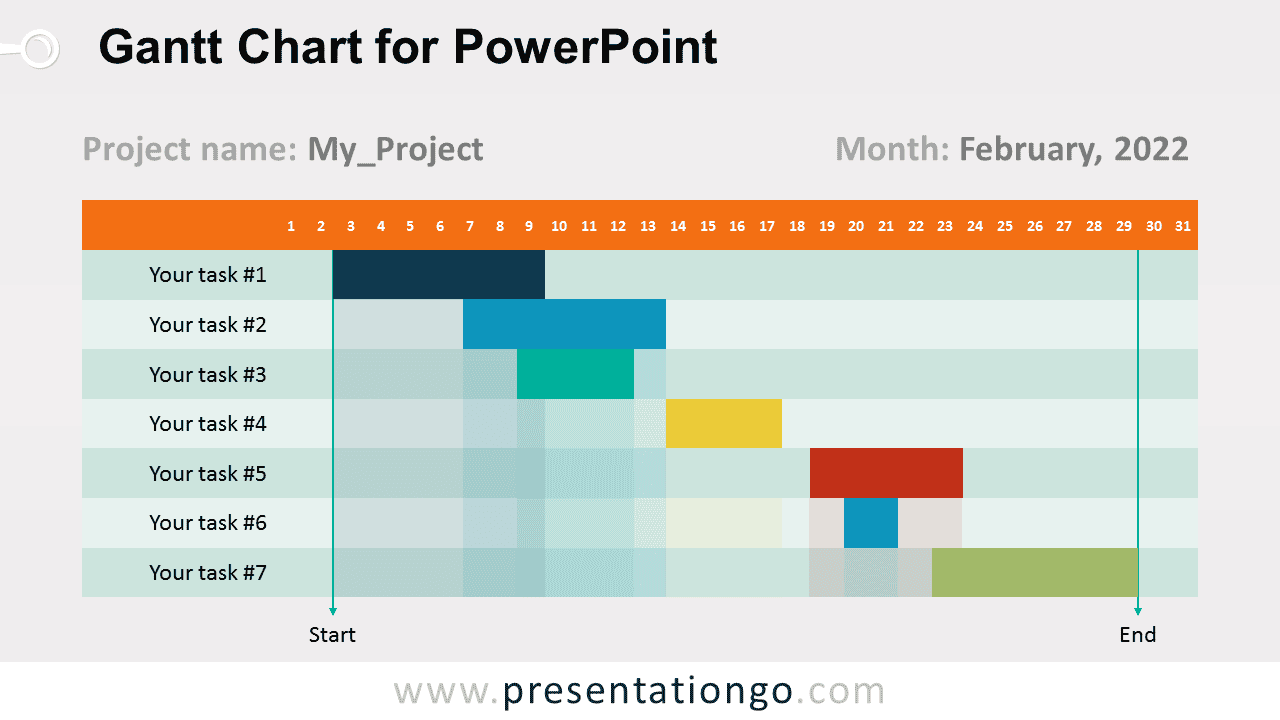
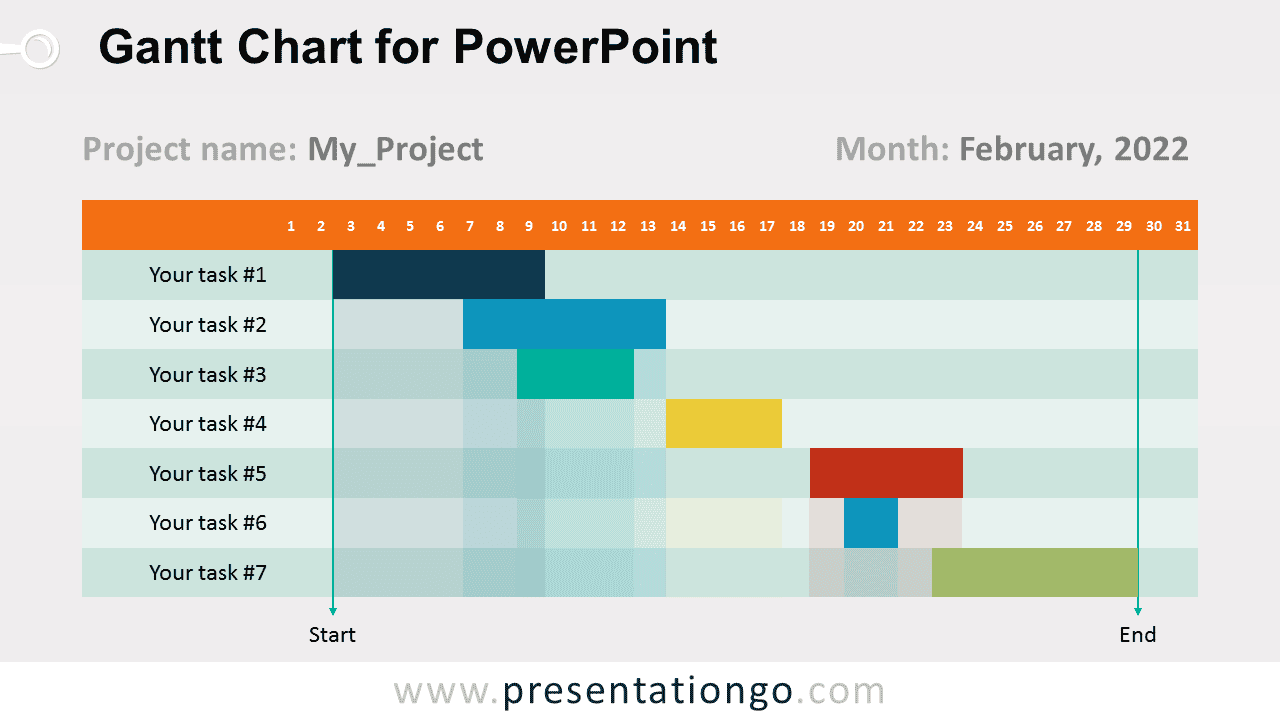
The Gantt Chart uses seven task rows aligned with a numbered monthly timeline. Horizontal schedule bars show the planned duration of each task, making overlaps and activity periods easy to compare. A project name and month appear above the chart, while vertical start and end markers define the active schedule range.
You can replace the task names, adjust the dates, move or resize the Gantt bars, and update the project information directly in PowerPoint. The chart works especially well for monthly planning because each day has its own column. The package also includes both 16:9 and 4:3 presentation sizes for different slide setups.
Practical Applications
- Plan a monthly project schedule
- Track task durations and deadlines
- Show overlapping project activities
- Organize team work assignments
- Present project milestones and phases
- Communicate delivery or implementation timelines
Summary
The Gantt Chart provides an editable PowerPoint layout for planning tasks across a monthly timeline. Its task rows, date columns, schedule bars, and start and end markers make it useful for project management, scheduling, milestone tracking, and workload planning.