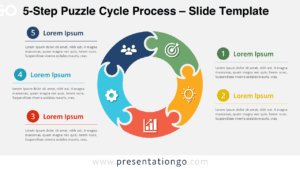
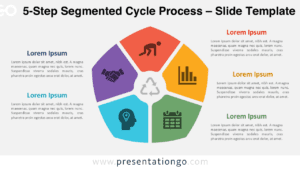
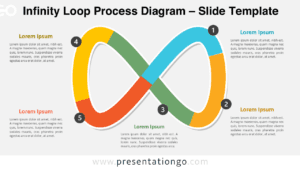
The Strategic Growth Cycle diagram provides a structured way to present a five-phase business strategy in a clear and engaging format. Designed for PowerPoint and Google Slides, this circular model helps you explain how vision transforms into measurable results through continuous improvement.
Diagram Preview


This diagram highlights five essential phases of sustainable growth: Vision, Strategy, Action, Results, and Evolve. Each stage connects in a circular flow, reinforcing the concept of continuous progress and long-term performance improvement.
Diagram Features and Customization Options
- Fully editable shapes and text elements
- 5-phase circular process layout
- Includes editable icon placeholders
- Light and dark background versions included
- Color-coded stages for clear visual hierarchy
- Compatible with PowerPoint and Google Slides
You can easily customize colors, text, and icons to match your brand guidelines. The central 360° element emphasizes holistic thinking and strategic alignment across all phases.
Design and Structure
The layout places a bold central circle at the core of the diagram, symbolizing a 360-degree strategic view. Around it, five evenly spaced circular nodes represent each business phase. Thin connector lines visually link each stage, creating a smooth and logical progression.
Each phase includes a meaningful icon: a light bulb for Vision, gears for Strategy, a lightning bolt for Action, a trophy for Results, and a magic wand for Evolution. These visual cues enhance clarity and improve audience engagement.
The balanced composition ensures readability in both executive boardrooms and training sessions. The clean typography and modern color palette support professional storytelling.
Practical Applications
- Corporate strategy presentations
- Business transformation roadmaps
- Consulting frameworks
- Annual planning meetings
- Startup pitch decks
- Performance review sessions
Whether you need to explain a high-level strategic roadmap or detail a performance improvement cycle, this diagram helps you communicate complex processes with confidence and clarity.
Summary
The Strategic Growth Cycle diagram offers a powerful visual slide for presenting continuous business improvement. With editable elements and dual background versions, it adapts easily to any professional presentation context.