Latest Templates
Discover our vast, continually growing collection of free, high-quality, customizable templates & Infographics for PowerPoint and Google Slides presentations, designed to enhance your visual communication.

Dual Parabolic Curves for PowerPoint and Google Slides
Boost PowerPoint and Google Slides presentation with our Dual Parabolic Curves diagram. Captivate and clarify using this versatile design.
Google Slides, PPTX
4:316:9

Radial Relationship Grid for PowerPoint and Google Slides
Upgrade your presentations with the Radial Relationship Grid, a versatile and customizable diagram for PowerPoint and Google Slides.
Google Slides, PPTX
4:316:9
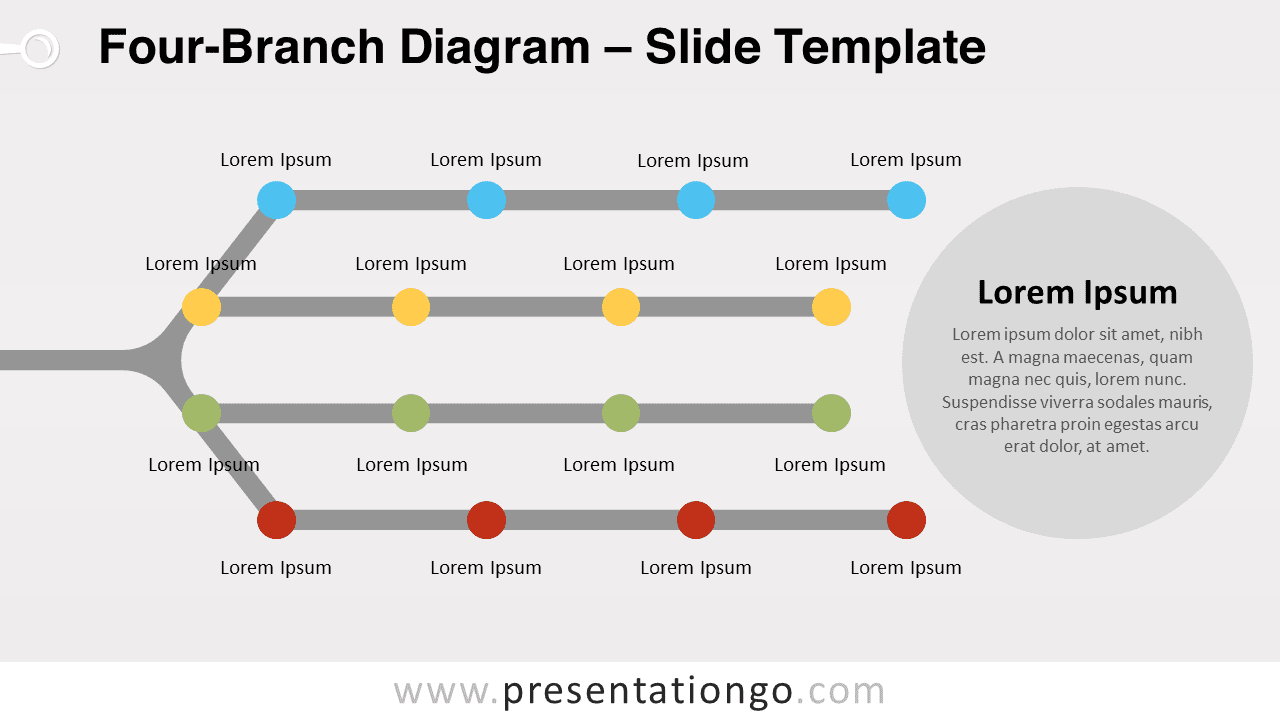
Four-Branch Diagram for PowerPoint and Google Slides
Download our free Four-Branch Diagram for PowerPoint and Google Slides. Present complex processes and options in an organized manner.
Google Slides, PPTX
4:316:9

Ribbon of Success for PowerPoint and Google Slides
Download the free Ribbon of Success diagram for PowerPoint and Google Slides, a striking visual metaphor to illustrate progress and success.
Google Slides, PPTX
4:316:9

Coastal Breeze – Custom Color Palette for PowerPoint
Download this Coastal Breeze color palette for your PowerPoint presentations, perfect for exuding energy, and a breath of fresh sea air.
XML File
Color Palette
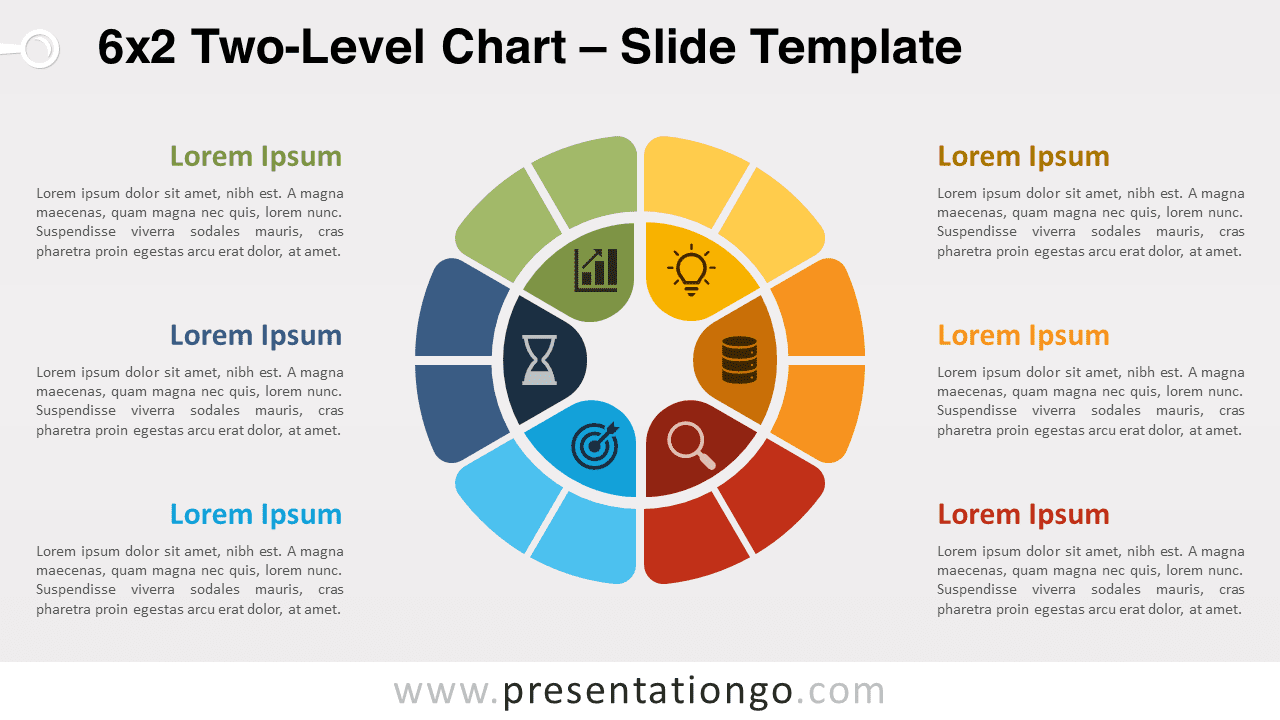
6×2 Two-Level Chart for PowerPoint and Google Slides
Showcase intricate, interconnected ideas in your presentations using the 6×2 Two-Level Chart for PowerPoint and Google Slides.
Google Slides, PPTX
4:316:9
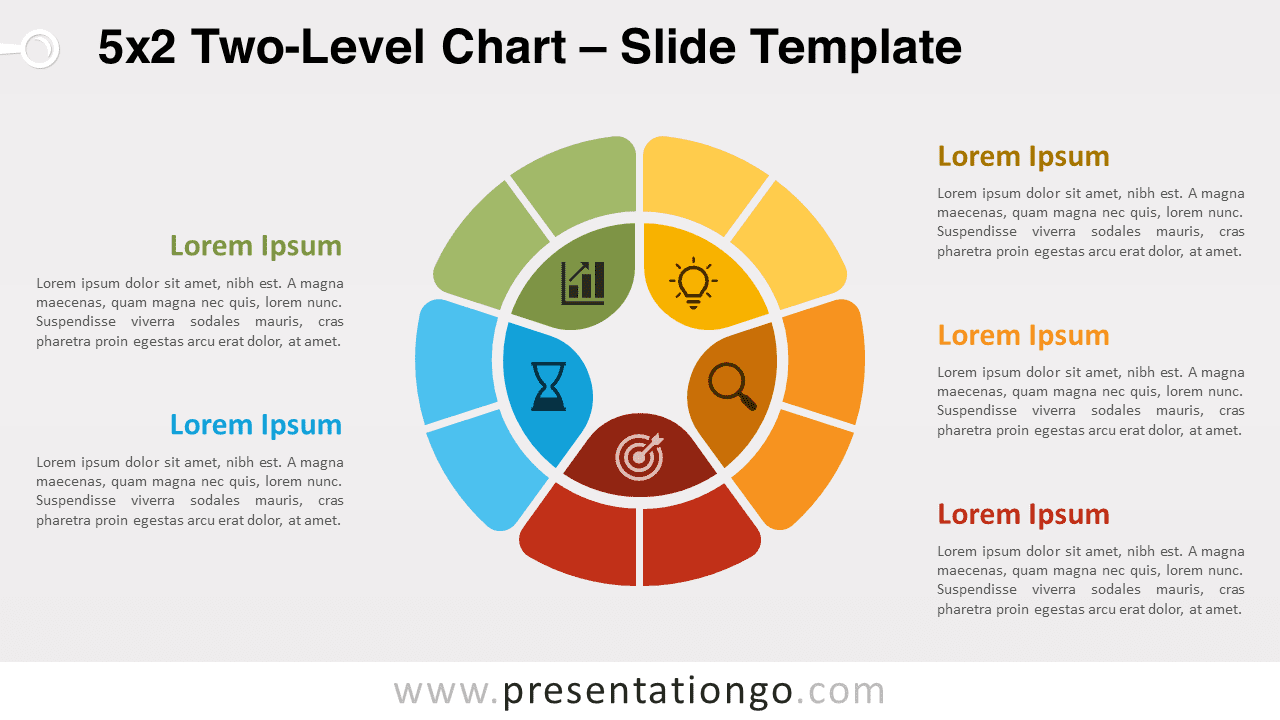
5×2 Two-Level Chart for PowerPoint and Google Slides
The versatile 5×2 Two-Level Chart template for PowerPoint and Google Slides will elevate your presentations with its modern and intuitive design.
Google Slides, PPTX
4:316:9

4×2 Two-Level Chart for PowerPoint and Google Slides
This free 4×2 Two-Level Chart for PowerPoint and Google Slides will showcase hierarchies and complex relationships. Editable graphics.
Google Slides, PPTX
4:316:9
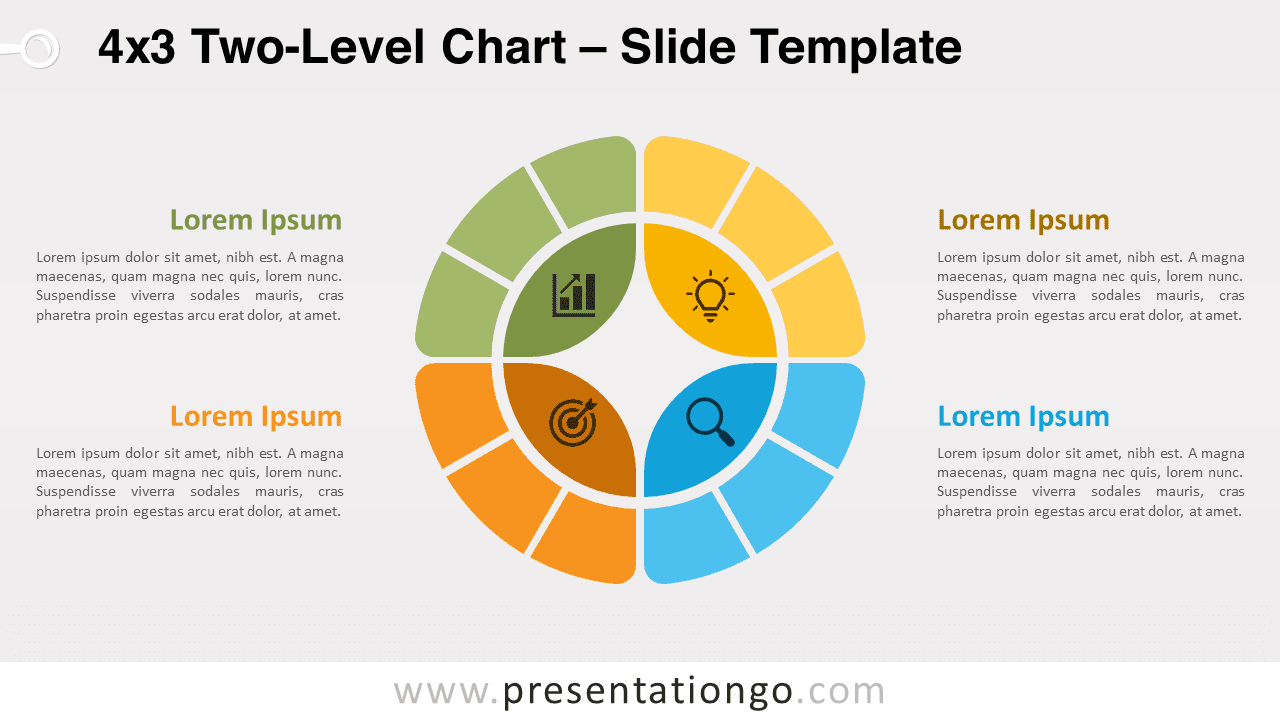
4×3 Two-Level Chart for PowerPoint and Google Slides
This free 4×3 Two-Level Chart for PowerPoint and Google Slides will help you complex, interconnected ideas, and hierarchies effectively.
Google Slides, PPTX
4:316:9

3×2 Two-Level Chart for PowerPoint and Google Slides
The 3×2 Two-Level Chart for PowerPoint and Google Slides is multi-level doughnut chart to simplify the presentation of interconnected ideas.
Google Slides, PPTX
4:316:9
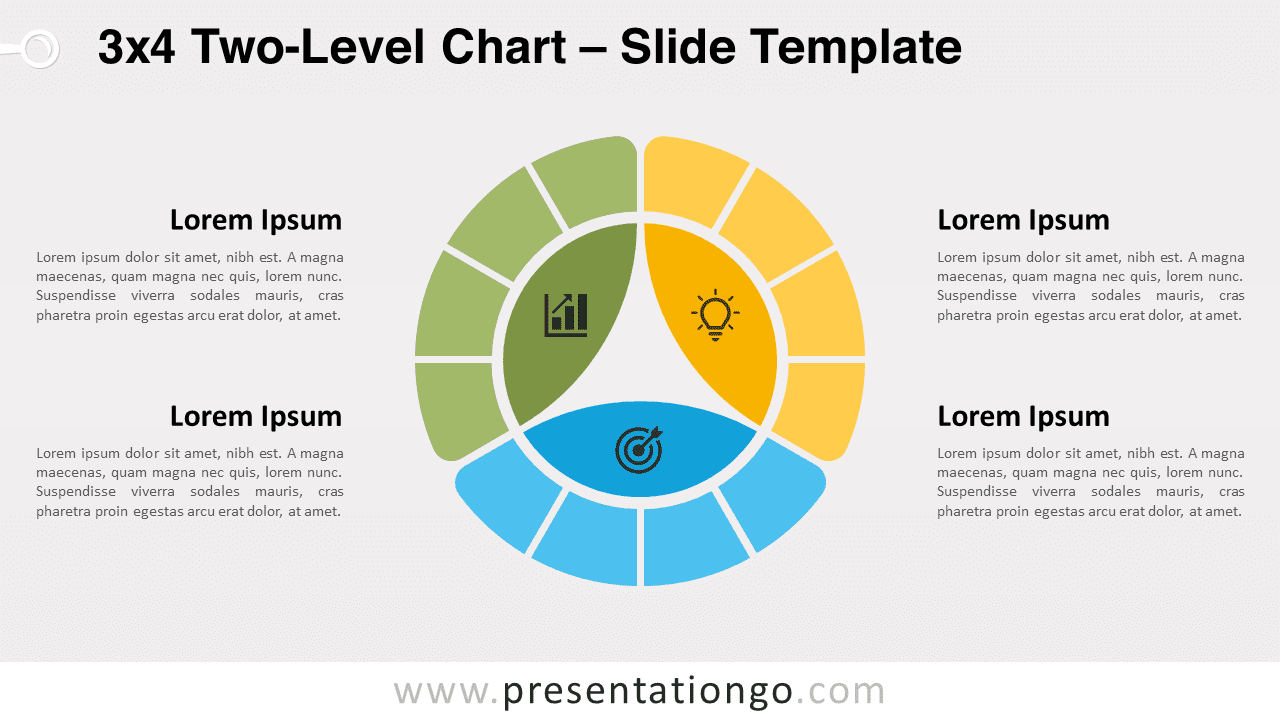
3×4 Two-Level Chart for PowerPoint and Google Slides
Enhance your presentations by showcasing complex relationships and hierarchies with the 3×4 Two-Level Chart for PowerPoint & Google Slides.
Google Slides, PPTX
4:316:9

2×5 Two-Level Chart for PowerPoint and Google Slides
Download the 2×5 Two-Level Chart for PowerPoint and Google Slides, a versatile graphic to convey complex, interconnected ideas with ease.
Google Slides, PPTX
4:316:9
