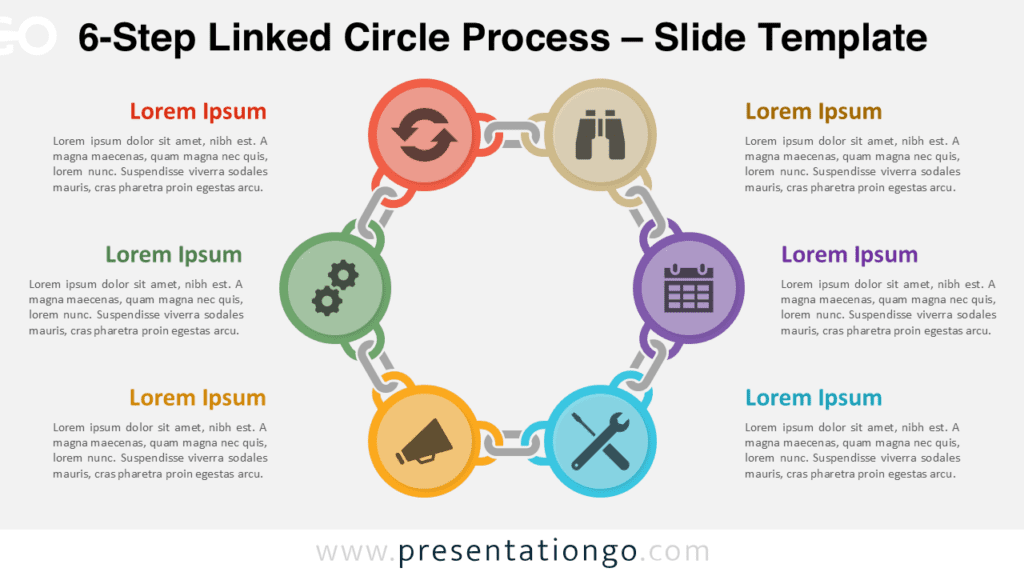
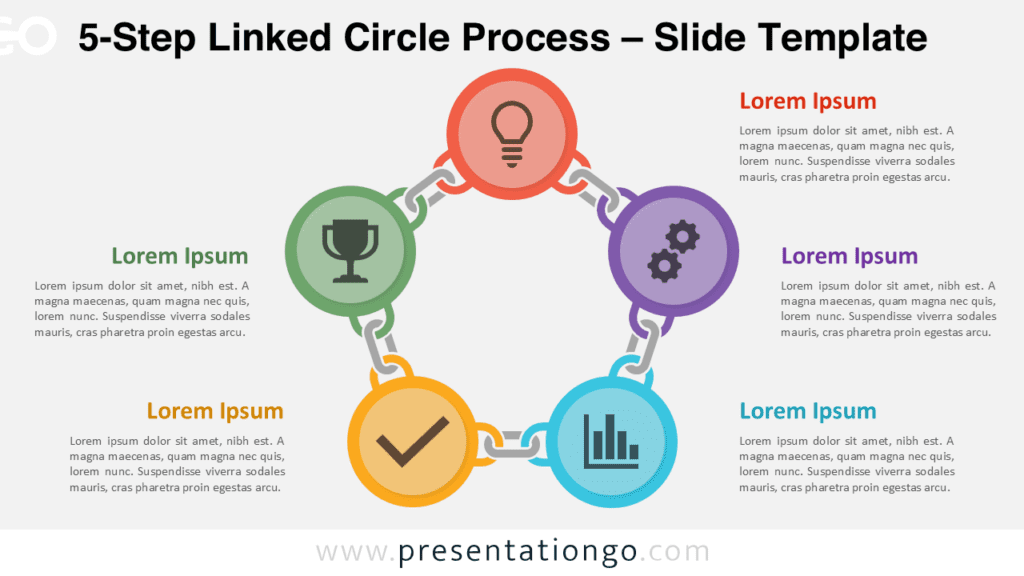
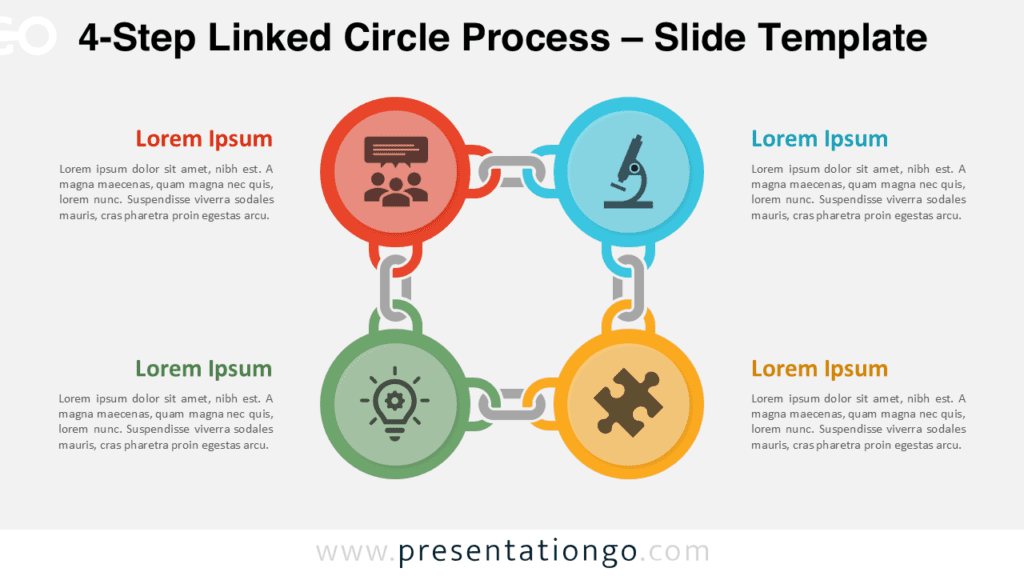
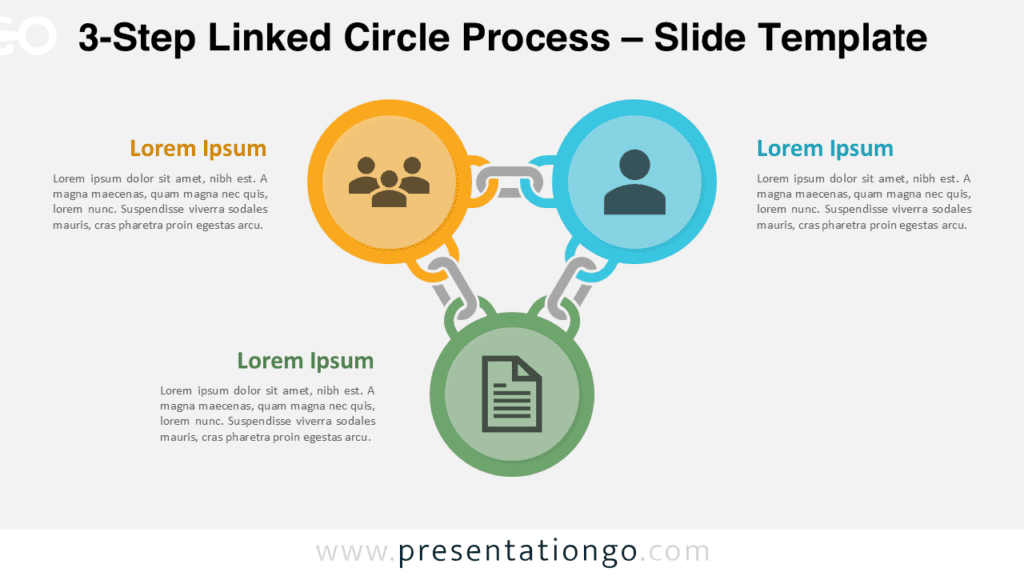
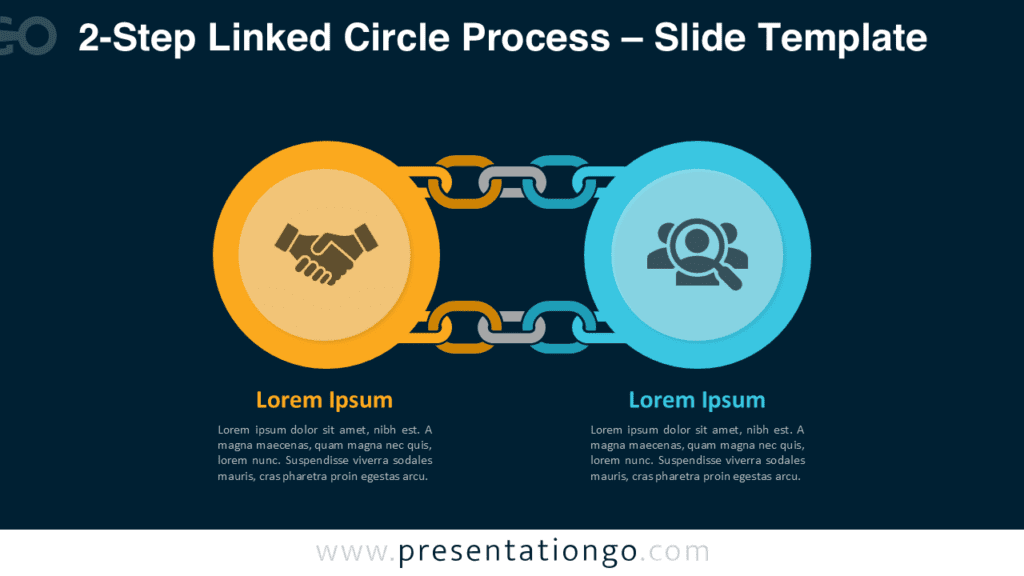
The 2-Step Linked Circle Process diagram helps you explain two connected ideas with a clean, modern layout. It is part of the Linked Circle Process series, which scales from 2-step to 6-step variations for longer workflows. Use this 2-step version when you want a strong visual for comparisons, cause-and-effect, or paired stages.
Diagram Preview
Preview the 2-Step Linked Circle Process diagram in both PowerPoint and Google Slides using the gallery below.
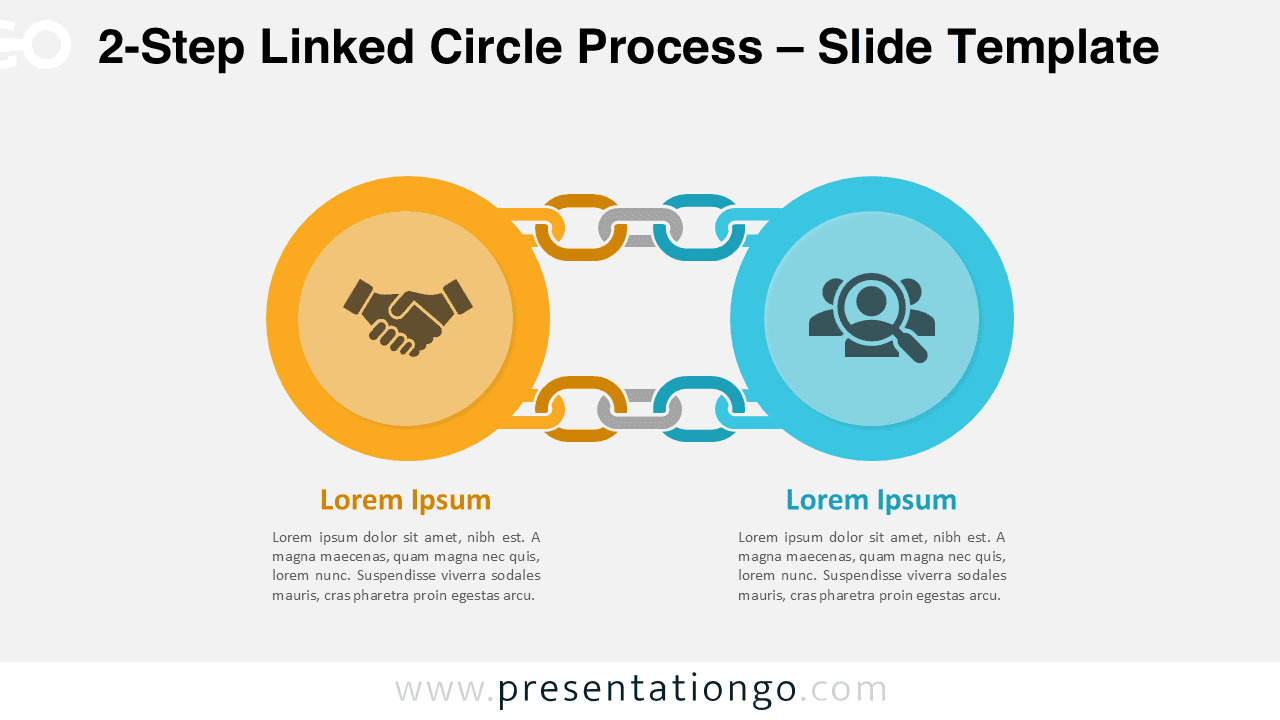
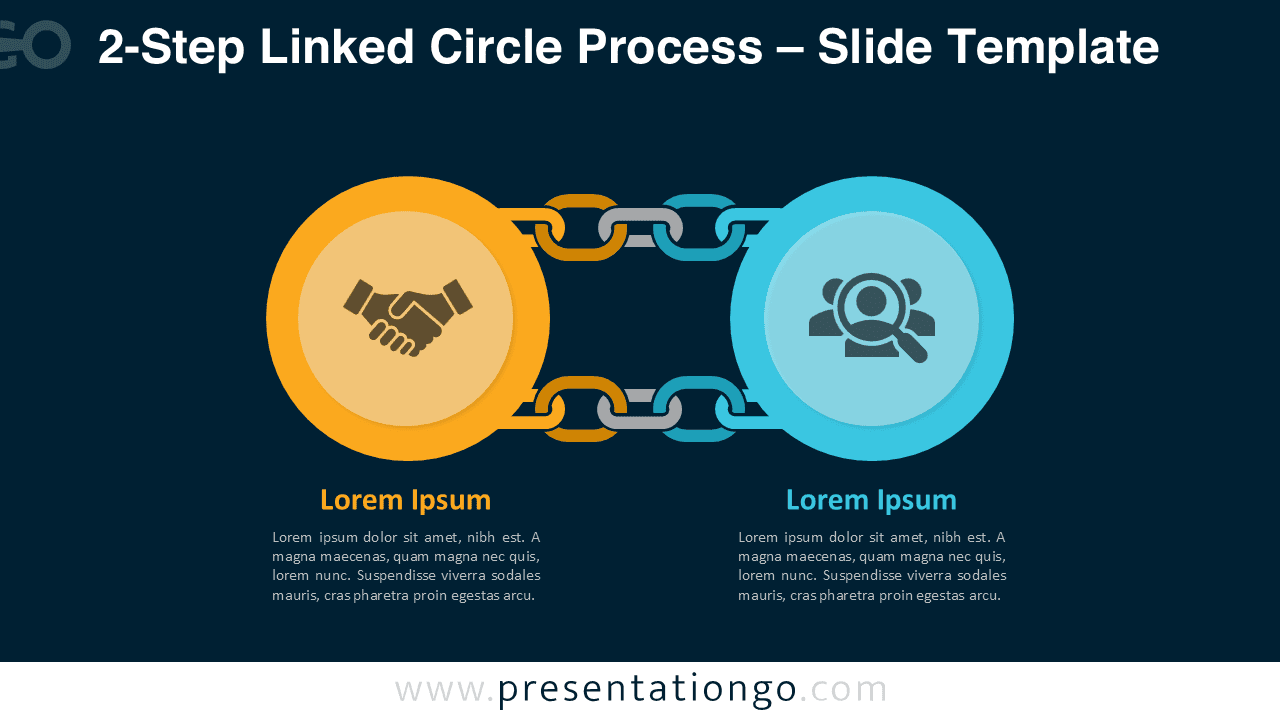
Diagram Features and Customization Options
- Two-step circular workflow structure designed for comparisons and paired concepts
- Editable shapes, connectors, and text placeholders
- Includes editable icon placeholders inside each circle
- Available in light and dark background versions
- Fully compatible with PowerPoint and Google Slides
Design and Structure
This diagram uses two bold circular nodes connected by interlocking links to communicate relationship and flow. Each circle includes a centered icon placeholder, plus a headline and body text area for clear messaging. The balanced left-right composition supports quick scanning and makes comparisons easy during live presentation. You can also adapt the layout for before-and-after, problem-and-solution, or internal-versus-external storytelling.
Practical Applications
- Compare two strategies, two product options, or two market segments.
- Explain cause and effect, input and output, or risk and mitigation.
- Show collaboration between two teams, departments, or partners.
- Present a two-phase rollout, milestone pair, or training module sequence.
Summary
The 2-Step Linked Circle Process diagram gives you a strong visual for two connected points in a single slide. It stays readable, supports icon-led communication, and adapts easily to many business and education contexts.
Complete Linked Circle Process Collection
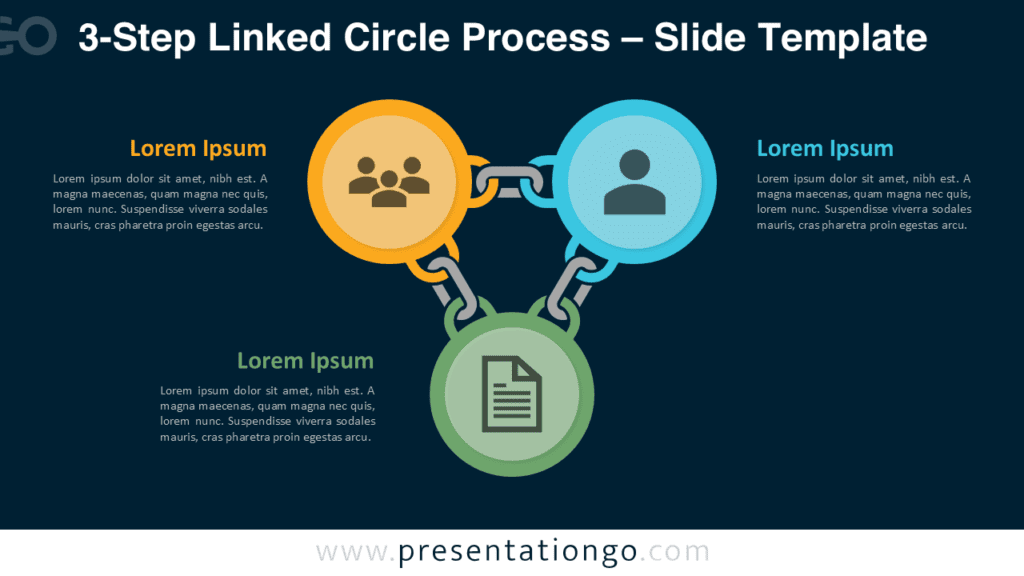
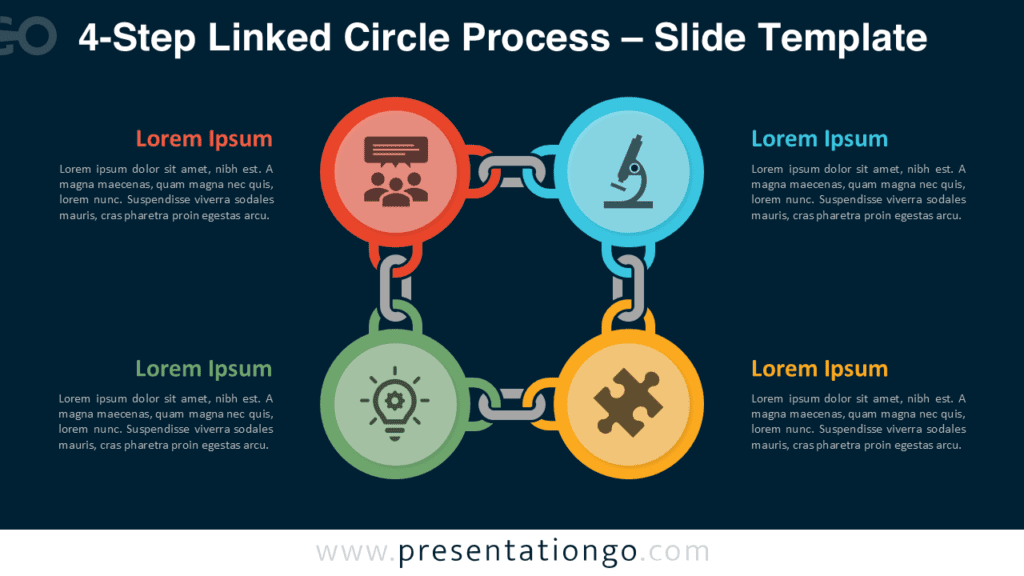
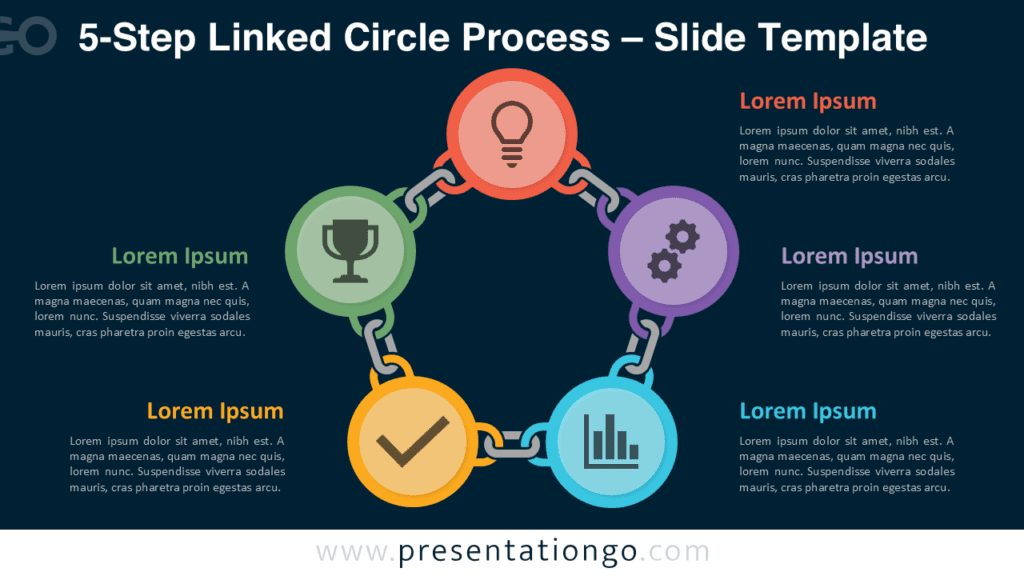
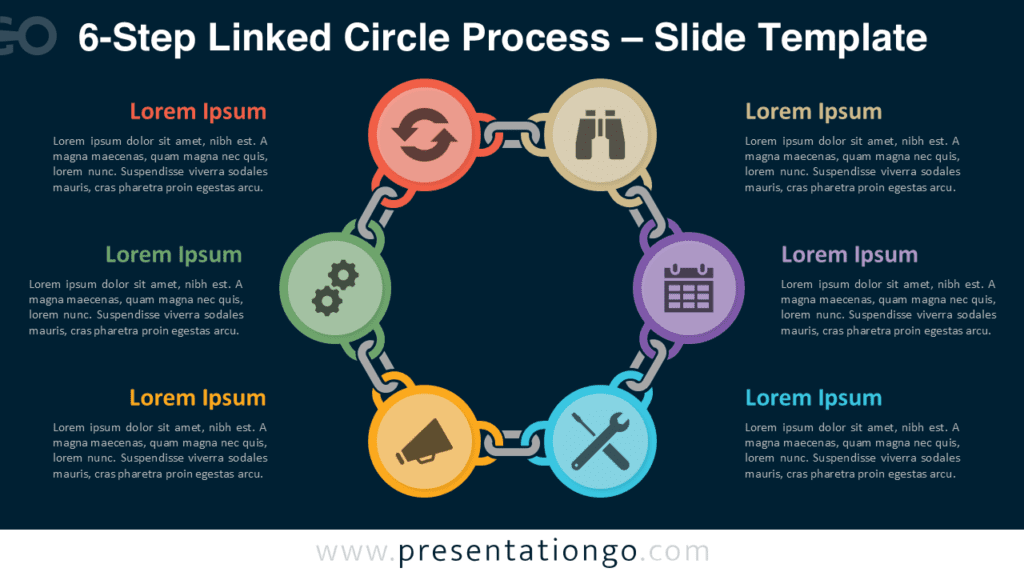
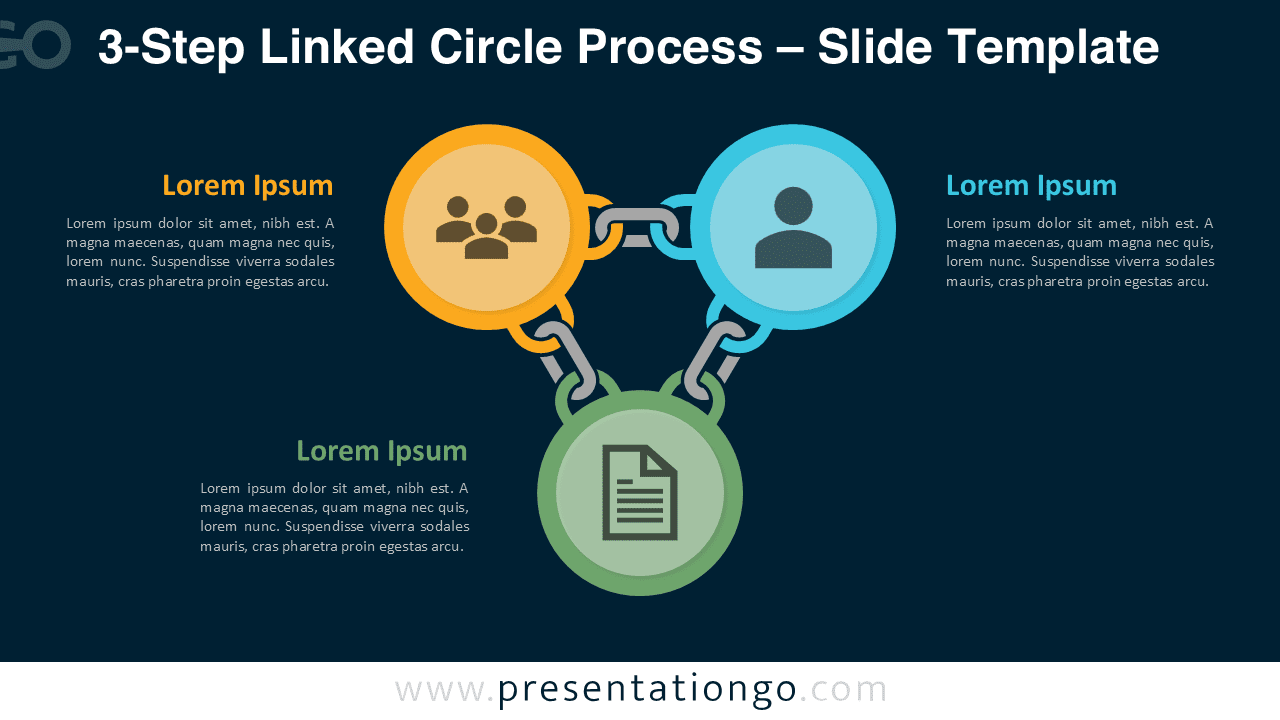
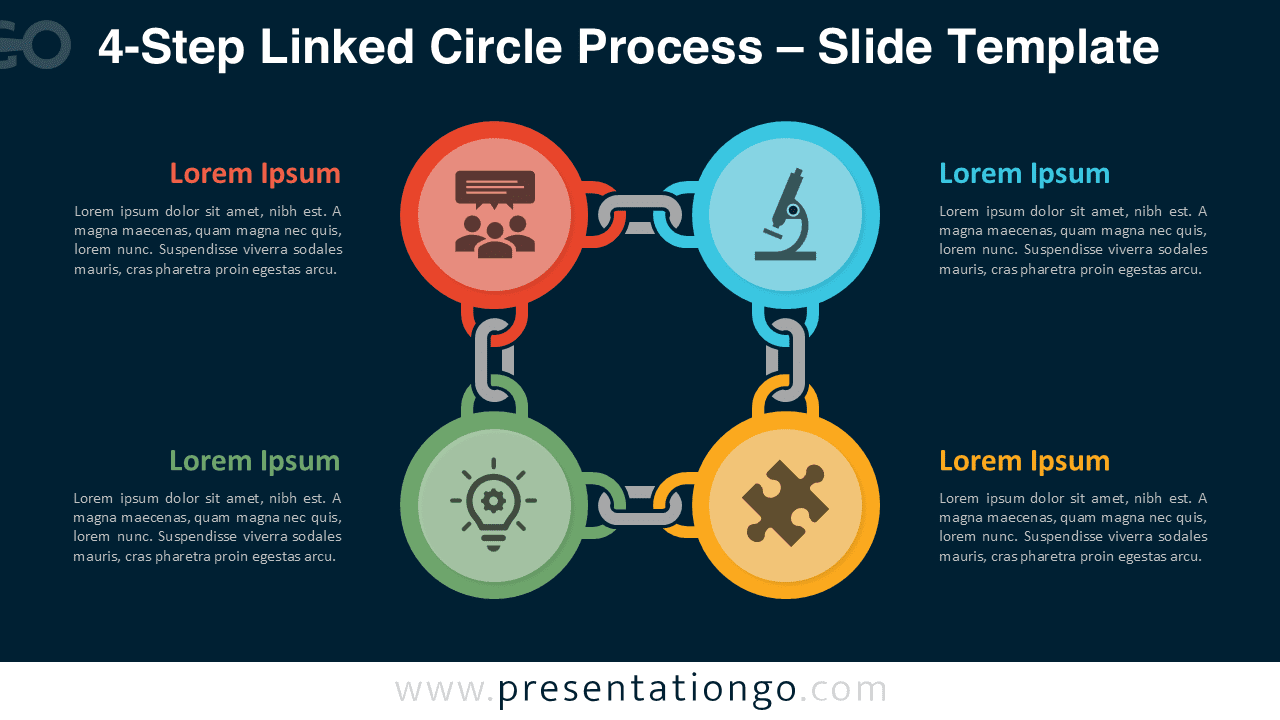
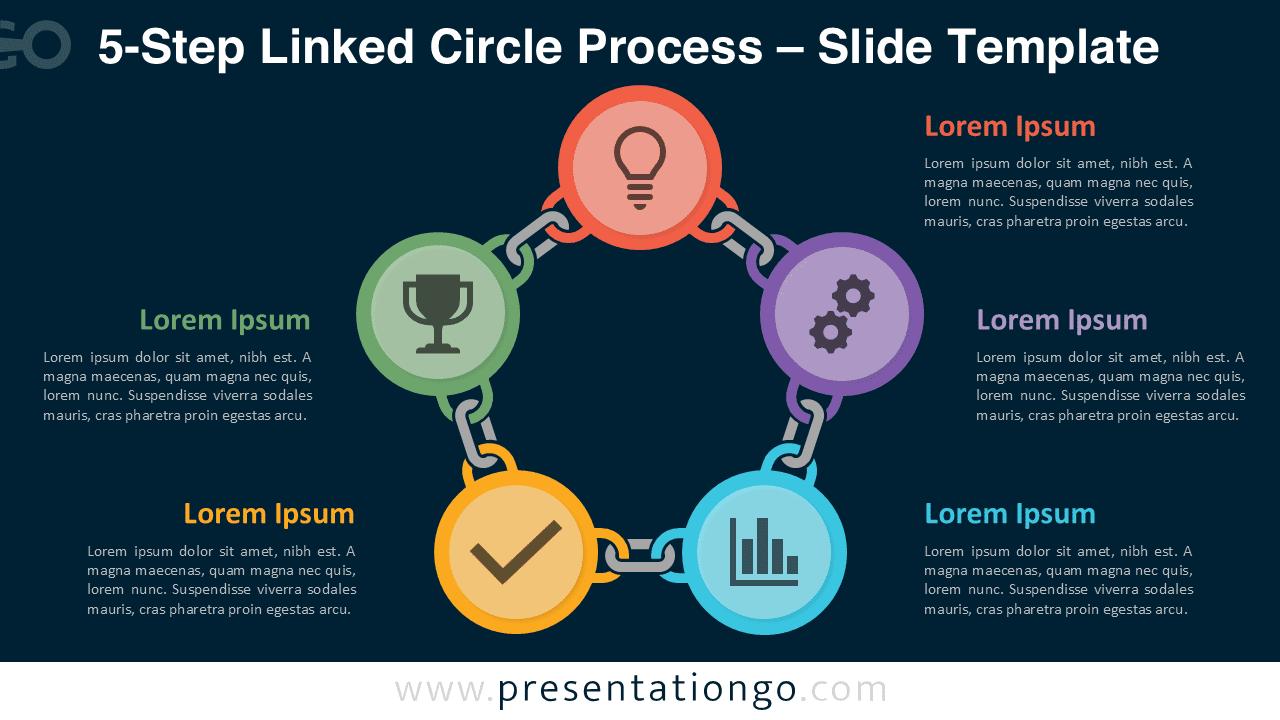
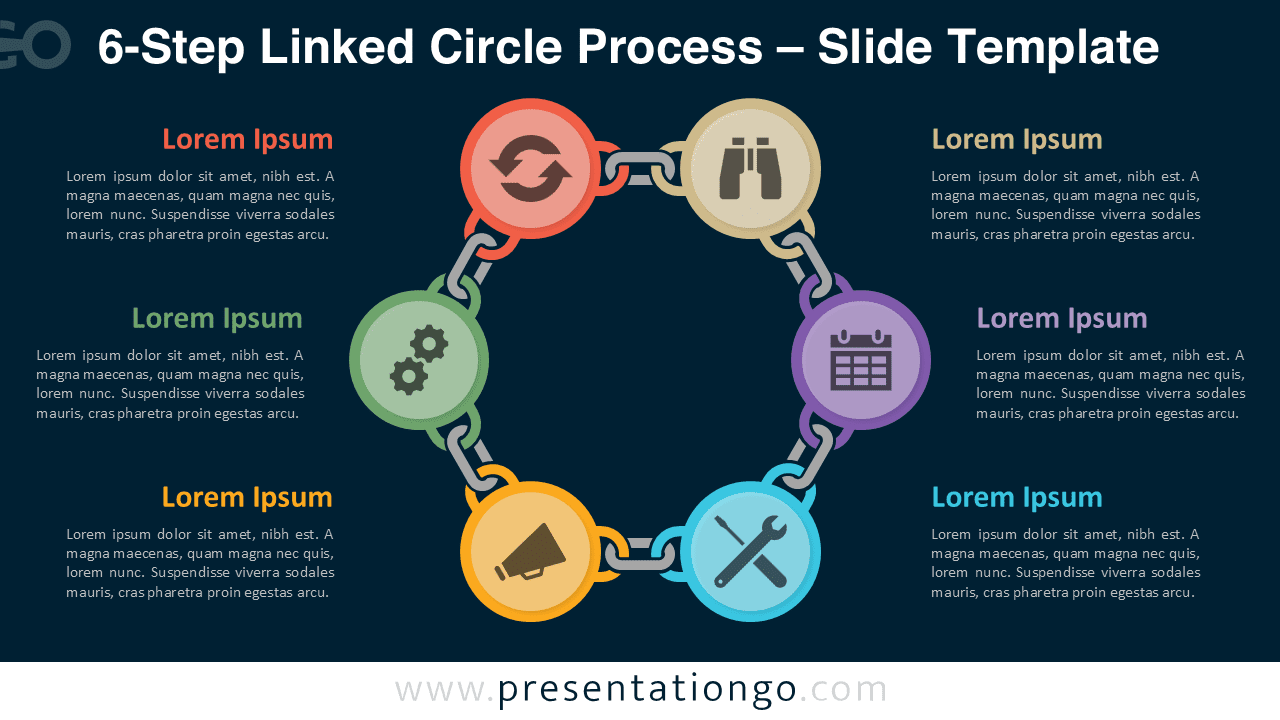
Need more steps for longer stories. Explore the full Linked Circle Process collection, including 3-step, 4-step, 5-step, and a 6-step version.
Frequently Asked Questions (FAQ)
Yes. The icons act as editable placeholders. You can recolor, replace, or swap them with your own visuals.
PowerPoint:
Right-click the icon and select Change Graphic → From Icons to choose a new built-in icon. You can also select Change Graphic → From a File to insert your own SVG or image. Once replaced, use Graphics Format → Graphics Fill to recolor the icon, and Align tools to center it inside the circle.
Google Slides:
Right-click the icon and choose Replace image, then select Upload from computer, Drive, or another source. After replacing the icon, use the toolbar Fill color options (for SVG icons) and the Arrange → Center on page tools to align it correctly within the shape.