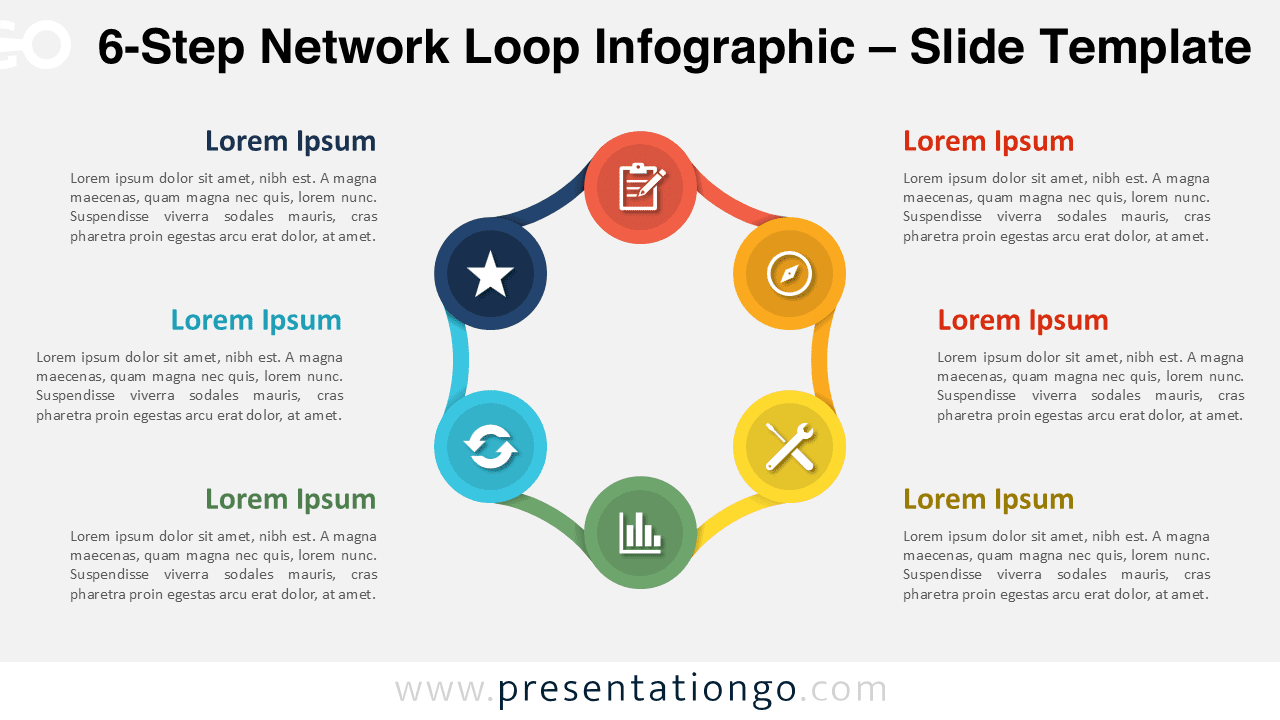
Visualize a six-step process with the 6-Step Network Loop Infographic. The continuous loop links six colorful nodes to represent complex workflows in PowerPoint and Google Slides.
Template Preview
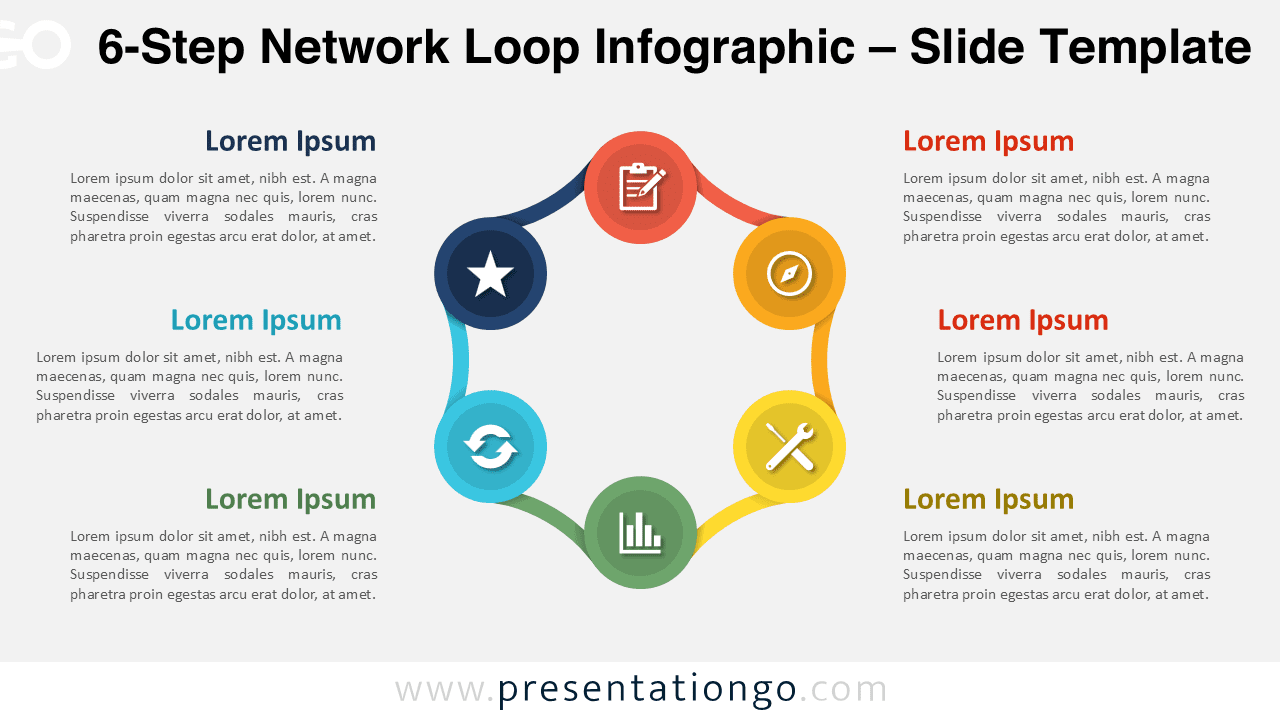
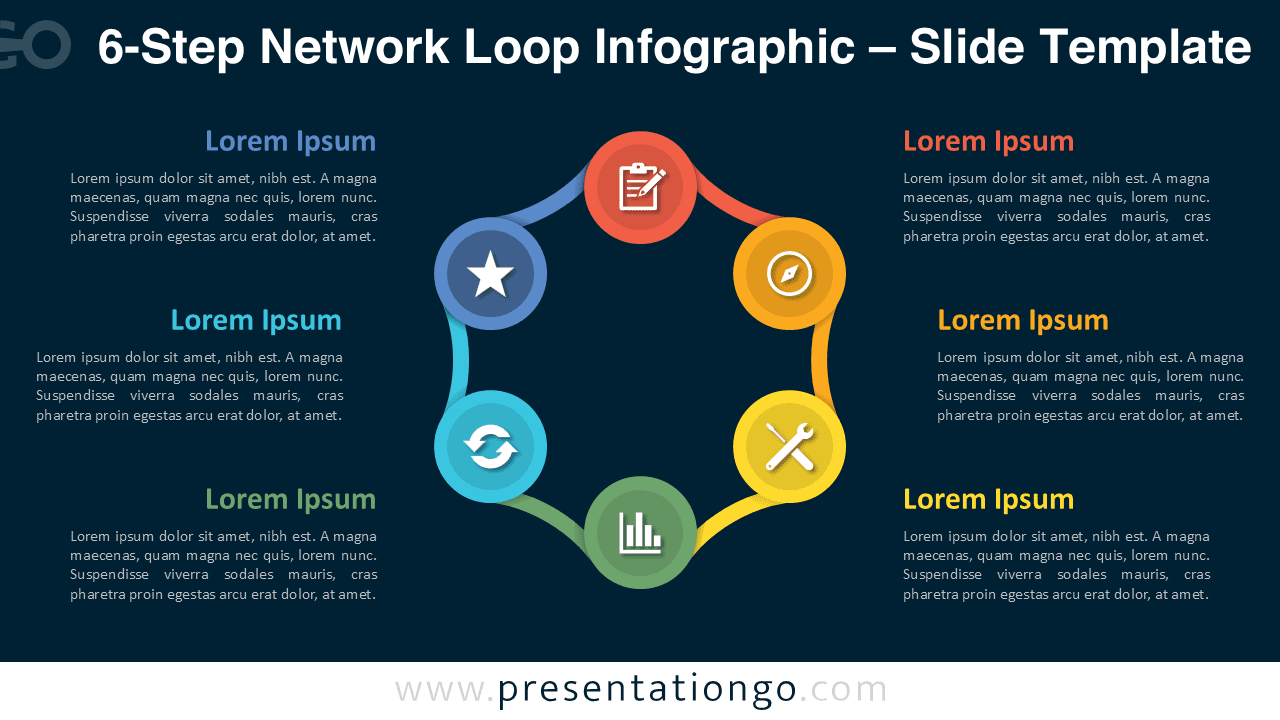


Features & Customization
- Includes 2 slides: light and dark backgrounds
- Six evenly connected circular nodes
- Fully editable in PowerPoint and Google Slides
- Vector shapes for scalability and precision
- Widescreen 16:9 layout for presentations
Design Overview
The 6-Step Network Loop Infographic showcases a complete circular chain of six nodes connected in a seamless loop. The structure radiates balance and progression, with each step represented by a distinct, vibrant color. Curved connectors link every element to the next, illustrating interdependence and continuous motion. The circular composition fits comfortably within the slide, leaving room for concise labels and icons near each node. Its symmetry and polished vector lines make it ideal for illustrating comprehensive workflows or cyclical strategies.
Practical Applications
- Six-phase business or marketing workflows
- Complex relationship or process visualization
- Strategic planning and operational loops
- Multi-department team structures
How to Edit
- Open the template in PowerPoint or Google Slides.
- Update text, icons, and colors as needed.
- Use the Slide Master for consistent branding.
Summary
The 6-Step Network Loop Infographic is perfect for showing extended processes and relationships. Customizable and easy to adapt for PowerPoint and Google Slides.
Complete Collection
This design is part of the Network Loop Infographic Series, available in 3-, 4-, 5-, and 6-step versions.


Frequently Asked Questions (FAQ)
You can swap the placeholder icons with any icon set or images. Resize freely; vector elements remain sharp.
In PowerPoint, right-click any icon, choose “Format Shape,” and change color or replace it. In Google Slides, use “Format options” to recolor or swap the icon directly.