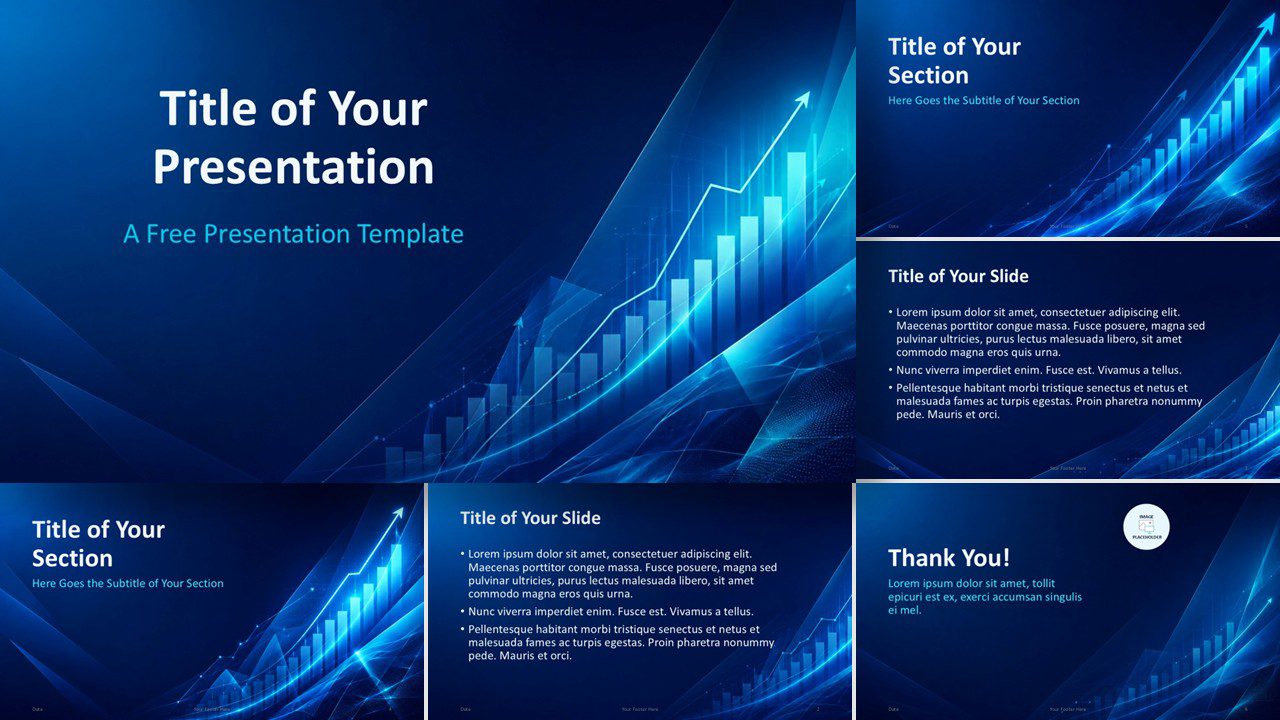
The Growth Analytics PowerPoint and Google Slides Template helps you present business performance with clarity and impact. Its dark blue visual style, glowing chart elements, and upward arrows create a strong growth-focused atmosphere. Use it to explain market trends, sales results, financial forecasts, strategic plans, or performance reviews with a polished corporate look.
Template Preview


Features and Customization Options
- Includes six editable presentation slides for PowerPoint and Google Slides.
- Uses a modern growth analytics theme with charts, arrows, and data-inspired visuals.
- Includes a specifically customized color palette that fits the template.
- Offers editable text placeholders for titles, subtitles, and body content.
- Provides section divider layouts for organizing longer business presentations.
- Includes a thank-you slide with an editable image placeholder.
- Uses Calibri for broad compatibility and easy editing across platforms.
Design Overview
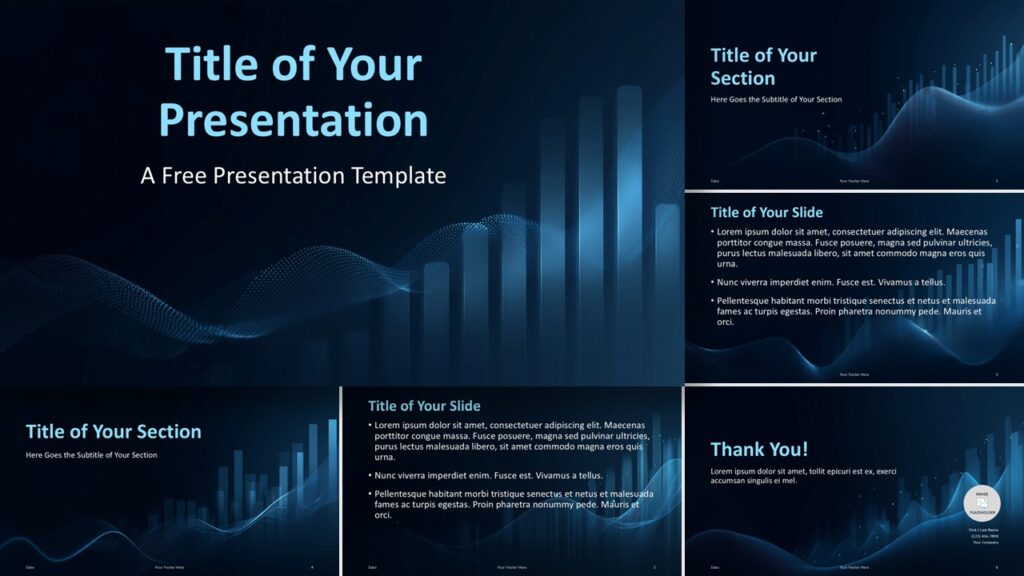
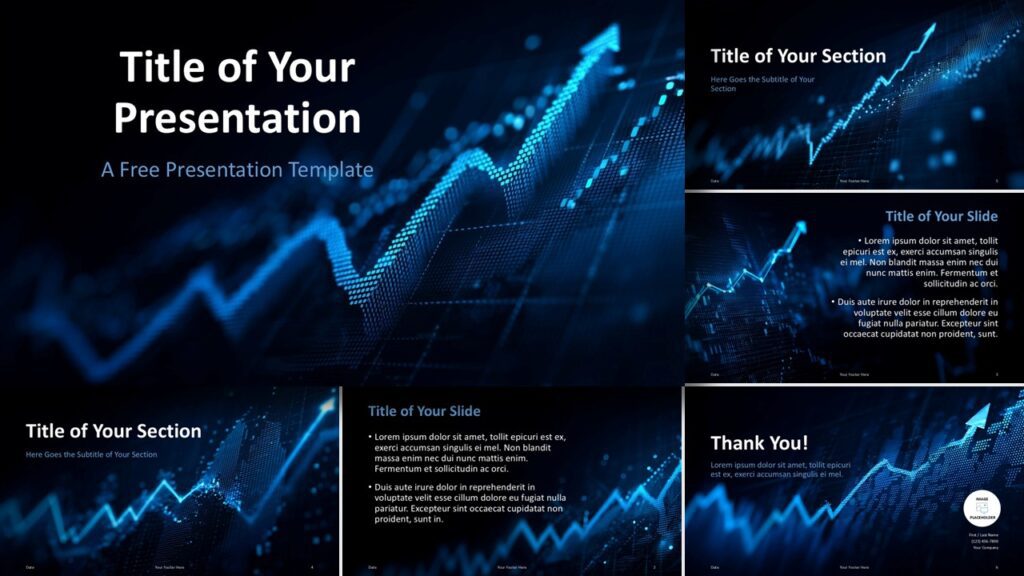
Growth Analytics uses a deep navy background with electric blue and cyan accents. This contrast creates a confident, high-tech tone while keeping the content readable. The design combines glowing financial charts, rising bars, line graphs, and transparent geometric overlays to reinforce progress and measurable performance. Large white headings guide attention, while cyan subtitles add energy and visual hierarchy.
The slide layouts support both short messages and detailed bullet content. The cover slide introduces the theme with a strong growth visual, while the content slides balance text with subtle chart imagery. The section dividers add rhythm and help presenters separate key topics. The final thank-you slide closes the deck with a consistent professional style.
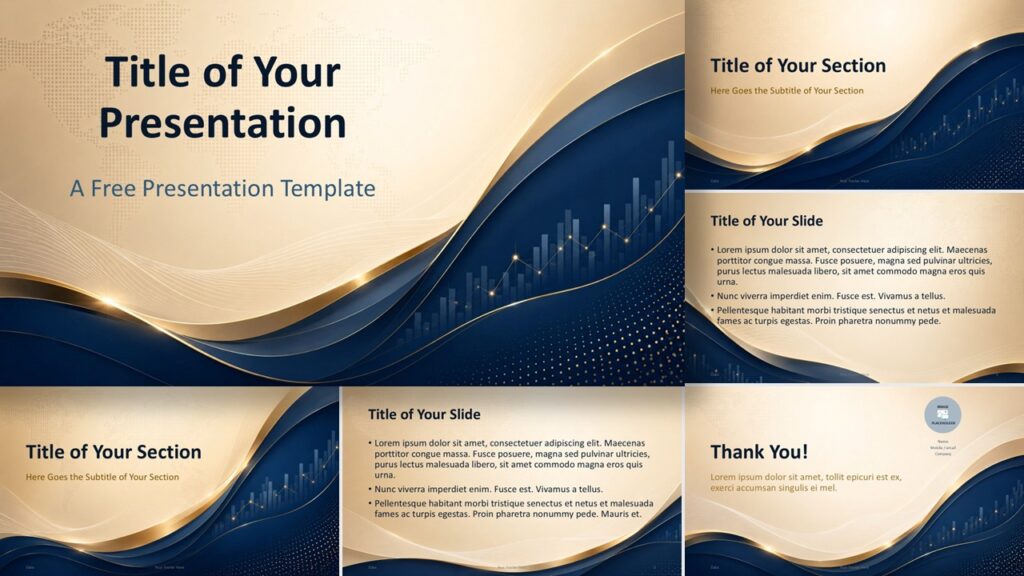
Custom Blue Growth-Inspired Color Palette
The palette combines Cyan, Electric Blue, Bright Cyan, Deep Blue, Steel Blue, and Navy Depth. These colors create a modern business look that supports data storytelling, financial analysis, and growth-focused presentations. The brighter tones highlight key information, while the deeper blues provide contrast, structure, and a premium corporate feel.
Practical Applications
- Business performance reports and quarterly reviews.
- Financial planning, sales updates, and revenue forecasts.
- Market research presentations and competitive analysis.
- Startup pitch decks and investor updates.
- Corporate strategy sessions and executive briefings.
- Analytics dashboards, KPI summaries, and growth plans.
Summary
The Growth Analytics PowerPoint and Google Slides Template gives you a professional way to present data-driven ideas. Its bold blue palette, rising chart visuals, and editable layouts make it ideal for business, finance, and strategy presentations. Download it for free and customize each slide to match your message, brand, and audience.