

The BCG Growth-Share Matrix is one of the most recognized strategic frameworks for analyzing product portfolios and market positioning. This editable BCG Growth-Share Matrix diagram for PowerPoint and Google Slides helps you present portfolio strategy clearly and professionally.
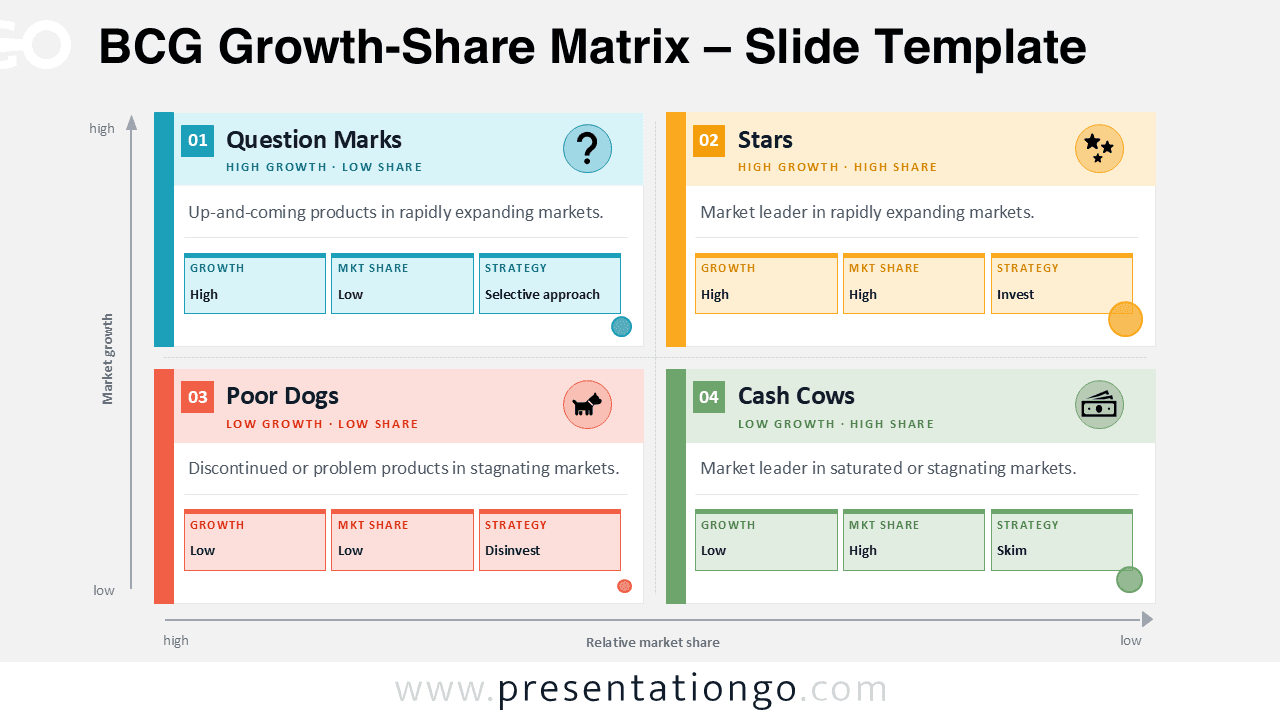
The diagram organizes products or business units into four categories based on two key dimensions: market growth and relative market share. This visual structure helps decision-makers identify where to invest, maintain, or divest resources within a portfolio.
Diagram Preview


Features and Customization Options
- Fully editable BCG Growth-Share Matrix layout
- Four clearly separated portfolio quadrants
- Modern card-style panels for each category
- Editable text placeholders for descriptions and strategies
- Includes editable icon placeholders for visual emphasis
- Available for both PowerPoint and Google Slides
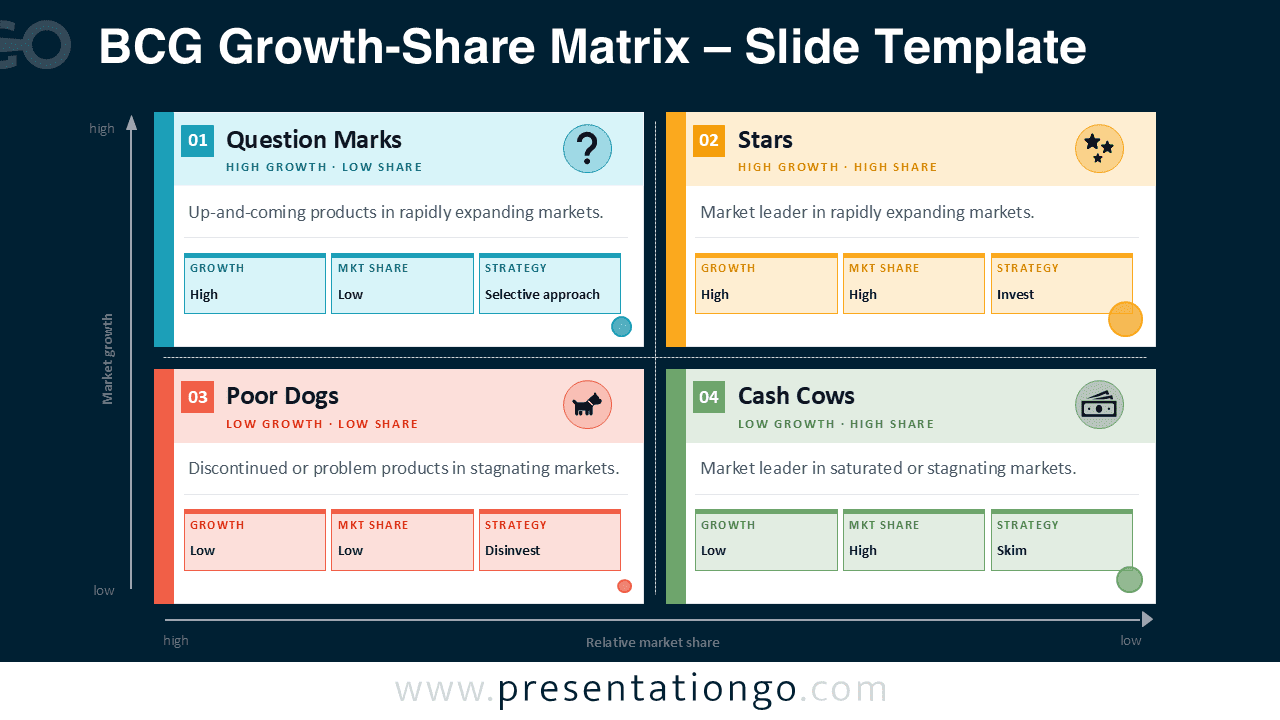
- Two slide versions included for different presentation themes
- Vector shapes allow easy resizing and recoloring
Design and Structure
The diagram uses a structured two-axis layout representing market growth and relative market share. These axes divide the slide into four quadrants that correspond to the classic BCG portfolio categories.
Each quadrant appears as a visually distinct panel containing a title, short description, and structured fields for growth, market share, and strategy. Color-coded sections help audiences quickly identify each category: Question Marks, Stars, Poor Dogs, and Cash Cows.
Icons reinforce the meaning of each quadrant and make the diagram easier to understand during presentations. The clean design ensures the matrix remains readable even when detailed explanations are added.
Practical Applications
- Product portfolio analysis
- Strategic planning presentations
- Marketing strategy workshops
- Business consulting reports
- MBA and business education lectures
- Investment portfolio discussions
- Corporate strategy meetings
Summary
This BCG Growth-Share Matrix diagram provides a clear and professional way to present portfolio analysis in PowerPoint and Google Slides. Its structured layout, editable elements, and modern design make it ideal for consultants, managers, educators, and strategists who need to explain business portfolio decisions visually.



