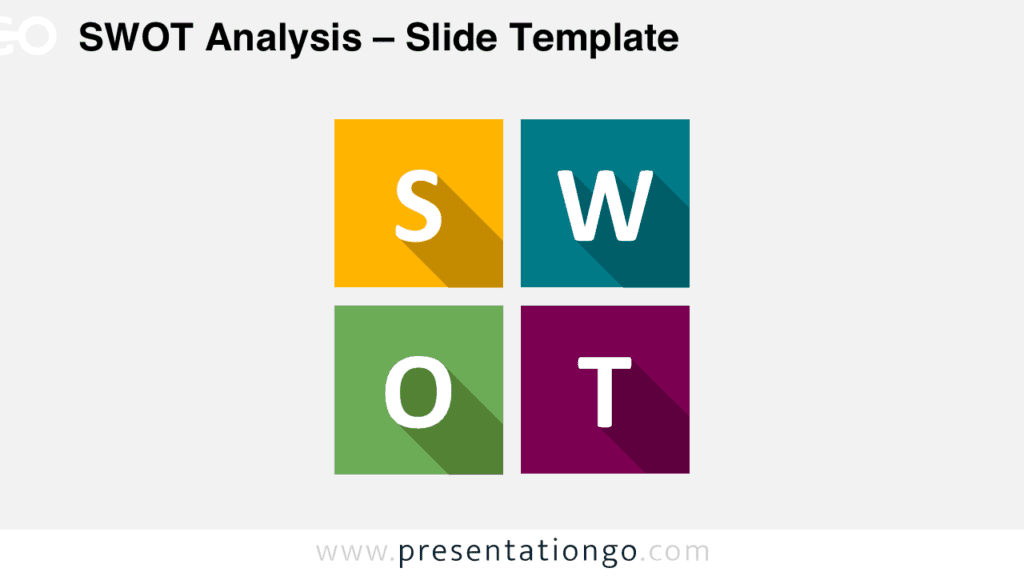
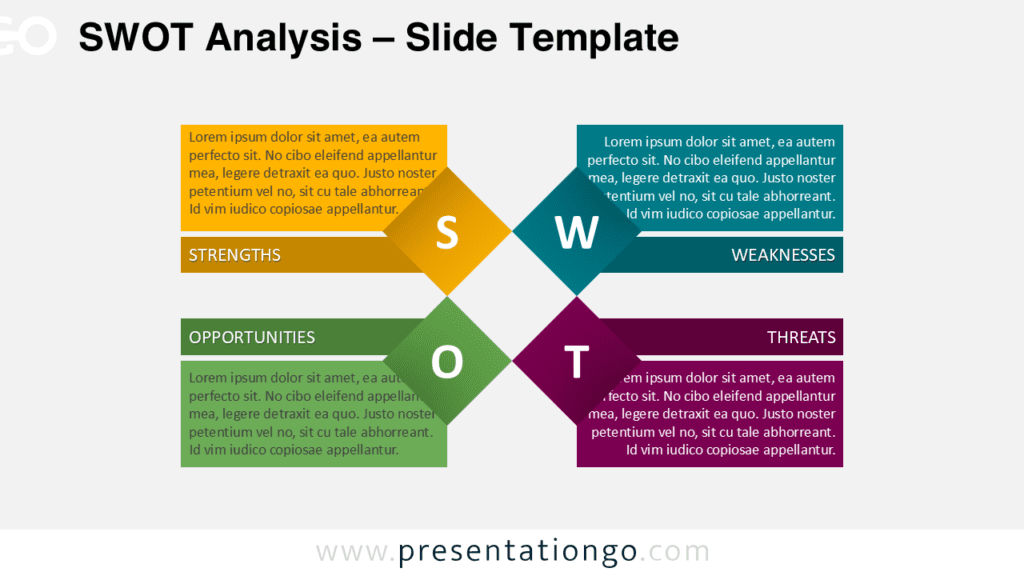
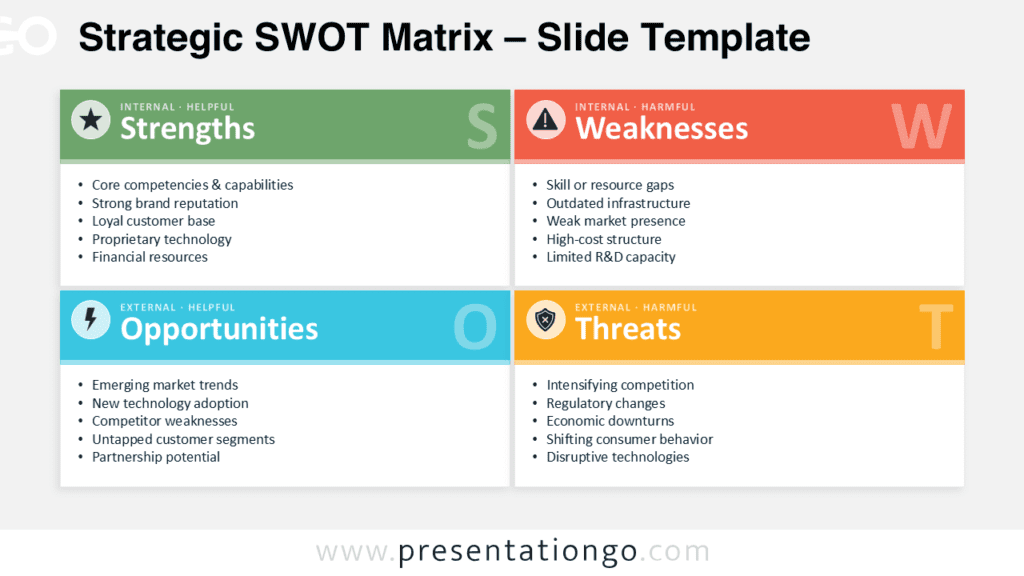
The Quadrant SWOT Diagram helps you present strengths, weaknesses, opportunities, and threats in one clear visual. Its balanced structure makes complex strategic information easier to review and discuss. The diagram works well in PowerPoint and Google Slides, so you can adapt it for meetings, workshops, reports, or planning sessions. Each quadrant provides space for a heading and supporting text, while the central SWOT label keeps the four areas visually connected.
Diagram Preview
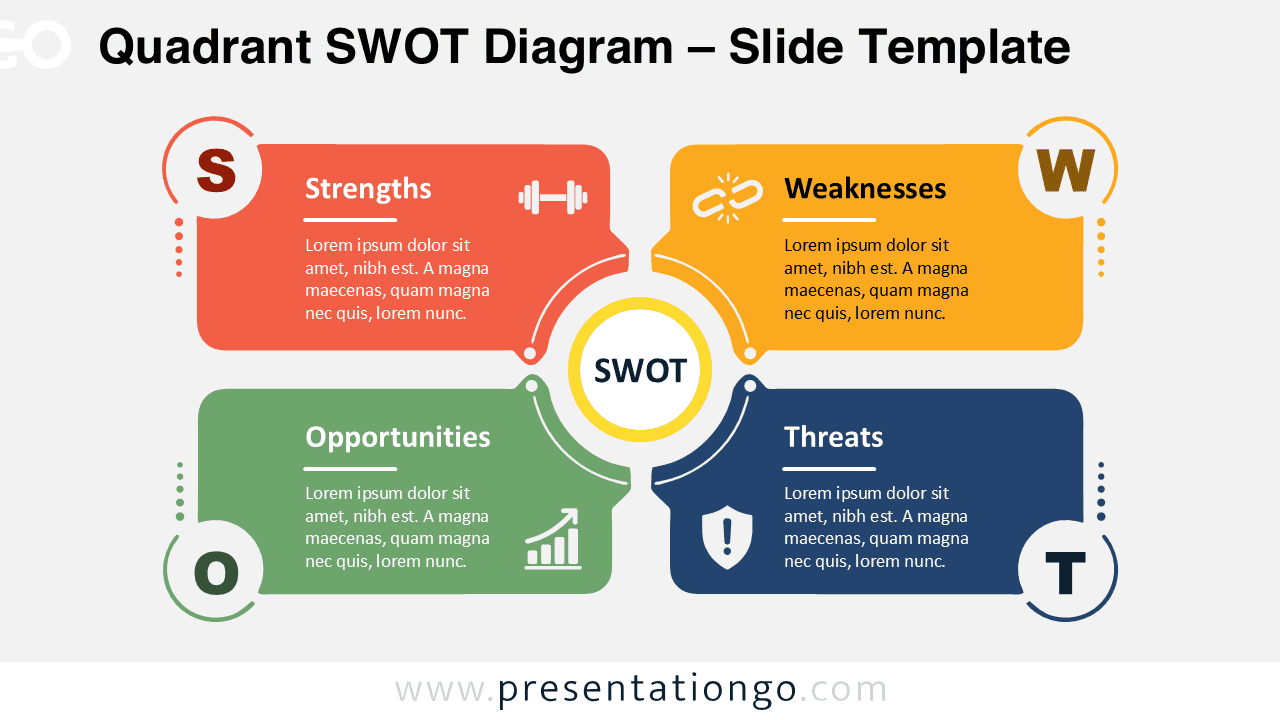
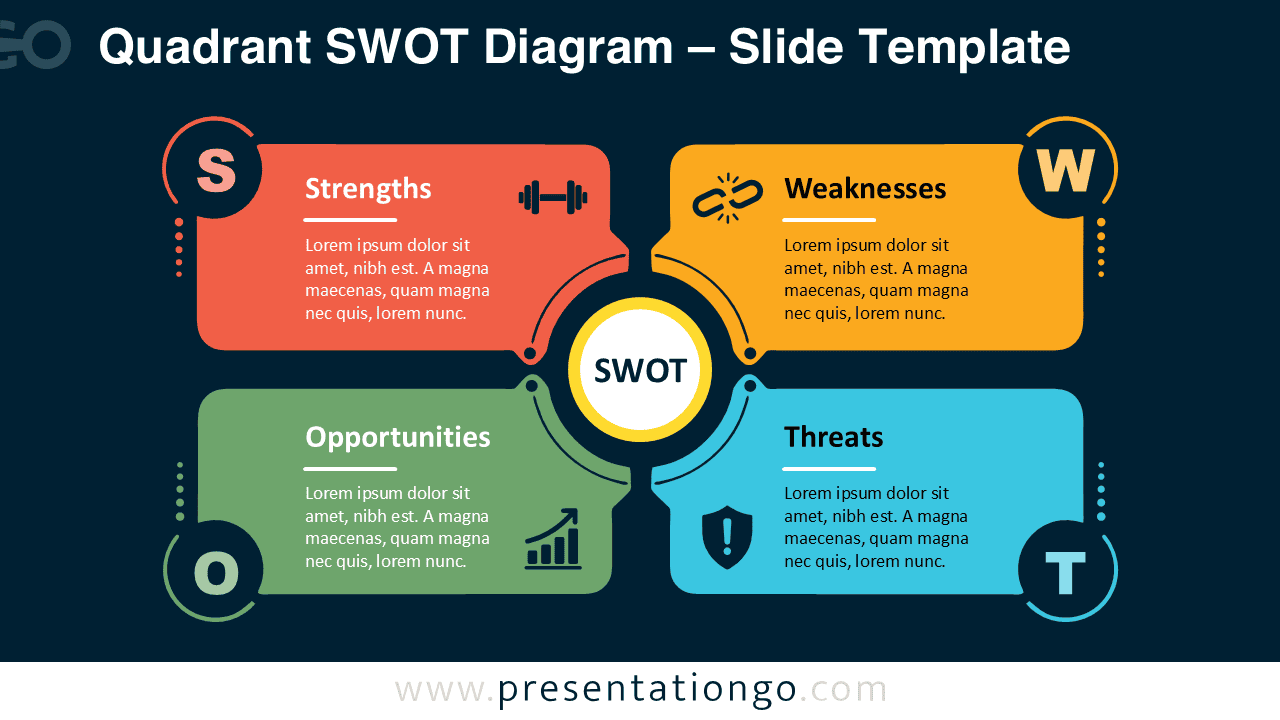
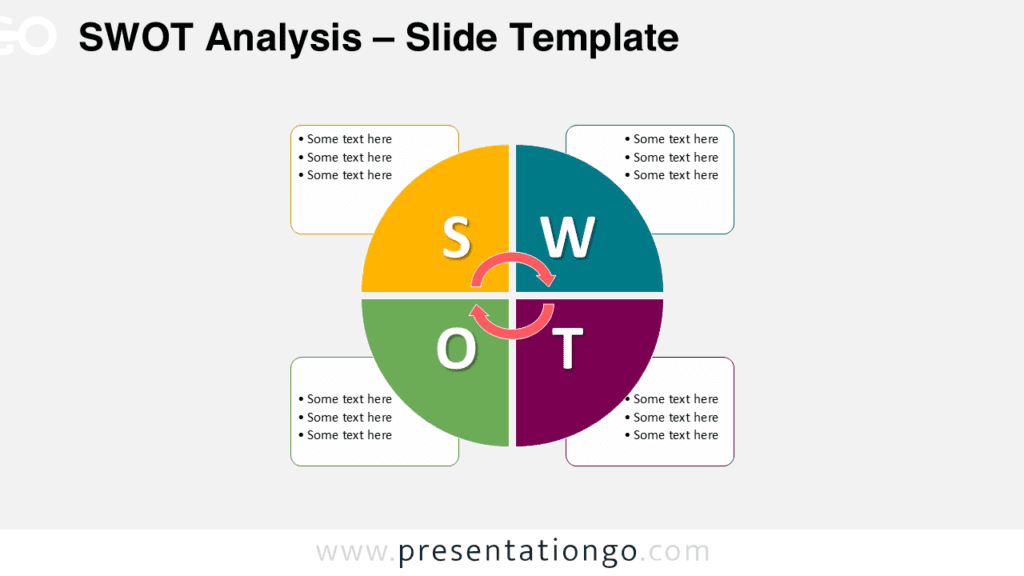
This diagram uses a familiar four-part SWOT structure with a more connected and polished layout. The central circle acts as a visual anchor, while each quadrant extends outward with enough room for concise insights. Large initials help viewers identify every section quickly. The arrangement supports a natural reading flow and keeps all four strategic factors visible at once.
Features and Customization Options
- Four editable SWOT quadrants
- Built-in icons within each quadrant shape
- Editable headings and body text
- Customizable shapes and connectors
- Light and dark slide versions
- PowerPoint and Google Slides compatibility
- Clear central SWOT label
- Balanced presentation-ready layout
Quadrant SWOT Diagram Design and Structure
The Quadrant SWOT Diagram separates internal and external factors without making the slide feel fragmented. Strengths and weaknesses appear across the upper area, while opportunities and threats sit below them. Curved connectors guide the eye toward the center and reinforce the relationship between all four categories.
The quadrant shapes include built-in icons that support each topic visually. These elements form part of the design and help audiences recognize the intended meaning faster. You can edit or replace them when your presentation requires a different visual approach. The large letter markers add another layer of navigation without taking space away from the main content.
For stronger results, keep each quadrant focused on the most important findings. Short statements work better than long paragraphs. You can also use consistent wording, such as action phrases or concise observations, to make comparisons easier. This approach keeps the slide readable during live presentations and useful when shared as a document.
Practical Applications
- Business strategy reviews
- Competitive market analysis
- Project planning workshops
- Risk assessment meetings
- Marketing strategy presentations
- Product launch evaluations
- Team brainstorming sessions
- Organizational performance reviews
- Consulting recommendations
- Executive decision-making
Summary
The Quadrant SWOT Diagram gives presenters a practical way to organize strategic findings and communicate them clearly. Its four connected sections, central focus point, and built-in visual elements create a professional structure without overwhelming the audience. Edit the text, shapes, and icons to match your subject, then use the light or dark version that best suits your presentation. The result is a flexible SWOT analysis slide that supports thoughtful discussion and confident decisions.