Free coffee cup Chart for PowerPoint and Google Slides. An original infographic option to share and compare quantitative results. Editable graphics with text placeholders.
Coffee Cup Chart
Coffee cups do not always mean coffee talk! In the case of this free Coffee Cup Chart template, you can use them to communicate very serious stats and numbers to your audience.
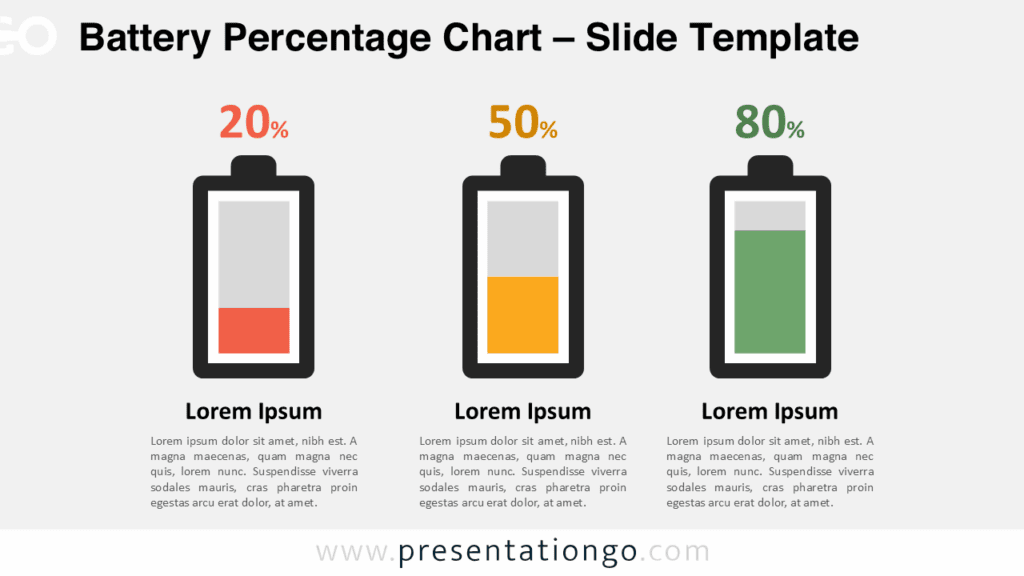
In this set of 3 slides, you can choose to share one or two numbers or percentages. The quantity of coffee in the cup represents your percentage or fraction. Besides, the exact number appears inside the cup (you will have to type it though as it is not data-driven). You will also find a large title and text placeholders to explain your quantitative results in detail.
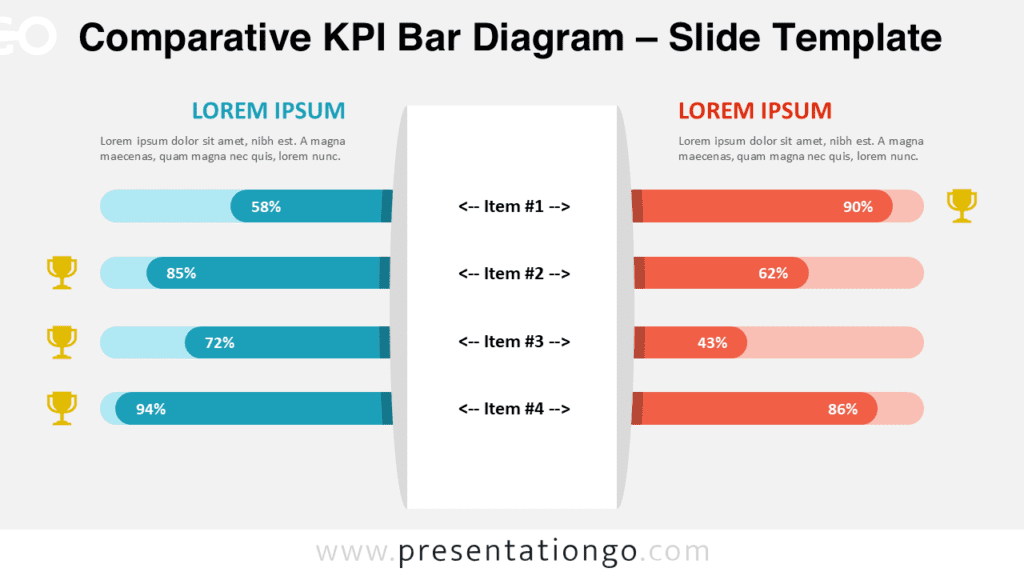
You can use this free Coffee Cup Chart template as a great infographic to share and compare quantitative results. It works as an alternative to a column chart as well. If boring diagrams are not your cup of tea, choose these cups of coffee!
Usage instructions:
Click the rectangle shape that illustrates the coffee liquid and adjust the height according to your needs.

Shapes are 100% editable: colors and sizes can be easily changed.
Includes 2 slide option designs: Standard (4:3) and Widescreen (16:9).
Widescreen (16:9) size preview:


This ‘Coffee Cup Chart’ template features:
- 3 unique slides
- Light and Dark layout
- Ready to use template with text placeholders
- Completely editable shapes
- Standard (4:3) and Widescreen (16:9) aspect ratios
- PPTX file (PowerPoint) and for Google Slides
Free fonts used:
- Helvetica (System Font)
- Calibri (System Font)