Free fuel pump chart for PowerPoint and Google Slides. Showcase and compare quantitative results about oil and gas topics. Editable graphics with percentage and text placeholders.
Fuel Pump Chart
Add some gasoline to your visual aids! This free Fuel Pump Chart will give the power and energy that your slides need!
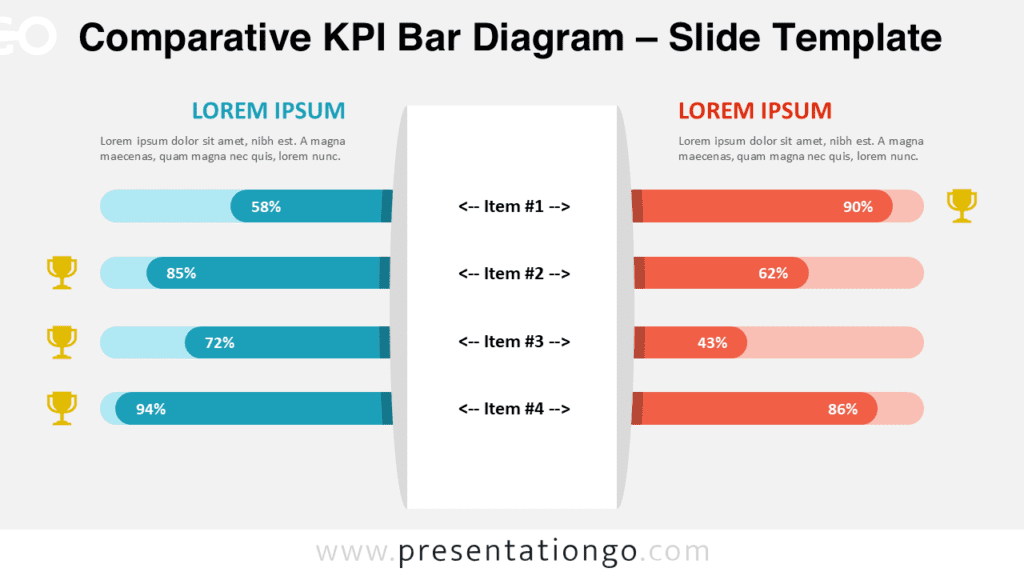
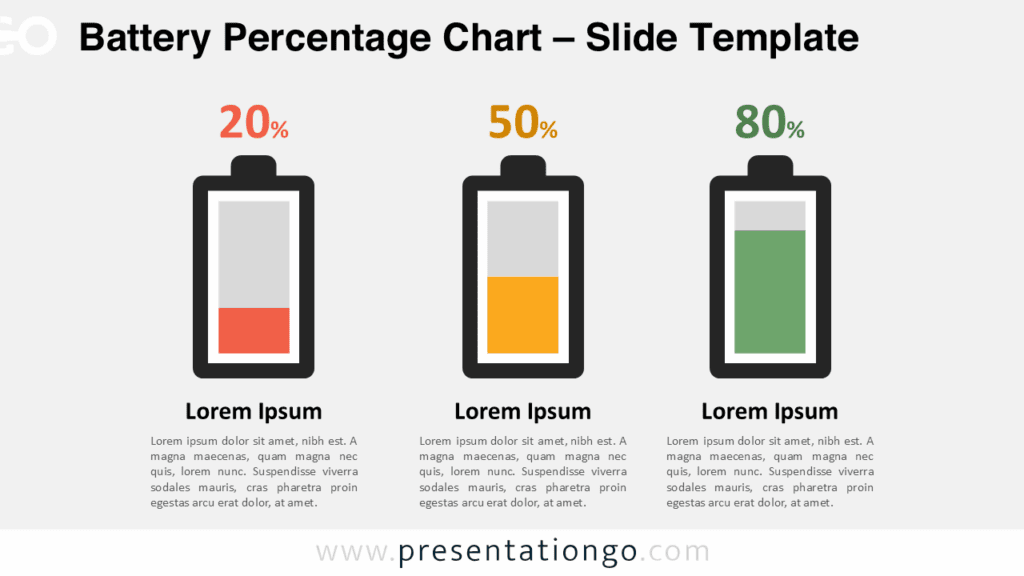
These two infographic slides offer you the possibility to show quantitative results to your attendees. Indeed, you can see one or two fuel pumps that you can fill with color in order to represent a quantity or percentage. You can also add the exact number or percentage inside the colored part of these column charts. Finally, you will find large text placeholders to insert a title and text to explain your data.
If you need clear data visualization, such as numbers or percentages, this free Fuel Pump Chart will do the trick! You can choose to illustrate one quantitative result or compare two of them.
Usage instructions:
Click the (orange) rectangle shape that illustrates and adjust the height according to your needs.
Shapes are 100% editable: colors and sizes can be easily changed.
Includes 2 slide option designs: Standard (4:3) and Widescreen (16:9).
Widescreen (16:9) size preview:


This ‘Fuel Pump Chart’ template features:
- 3 unique slides
- Light and Dark layout
- Ready to use template with percentage and text placeholders
- Completely editable shapes
- Standard (4:3) and Widescreen (16:9) aspect ratios
- PPTX file (PowerPoint) and for Google Slides
Free fonts used:
- Helvetica (System Font)
- Calibri (System Font)