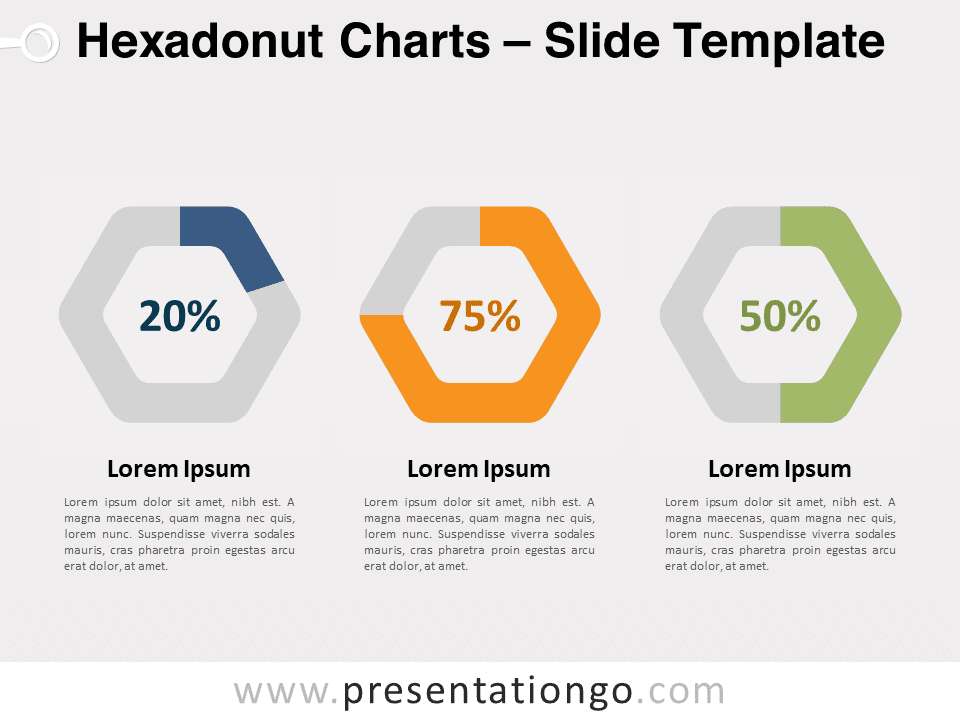
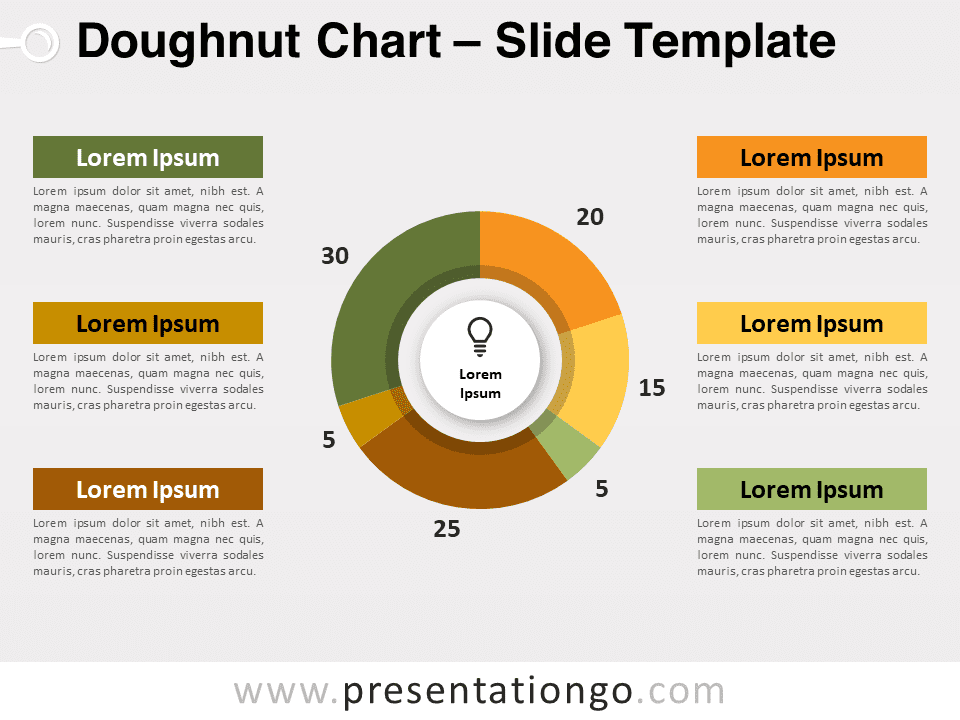
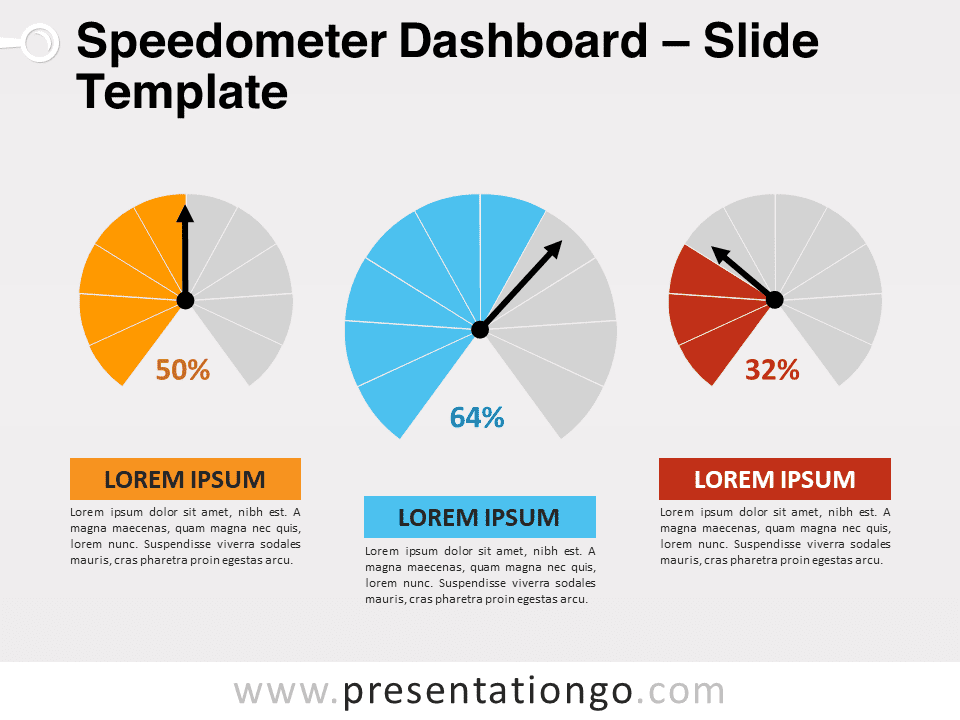
Unleash the potential of data-driven Hexadonut Charts for PowerPoint and Google Slides. This series of innovative and versatile charts are perfect for comparing data across different categories, making your presentations more engaging and professional. Editable graphics with data-driven (pie) charts.
Hexadonut Charts
Elevate your presentations with our data-driven Hexadonut Charts for PowerPoint and Google Slides! These visually striking graphics have been meticulously crafted to help you present and compare data seamlessly. Indeed, perfect for displaying market shares, performance metrics, or any other relevant information, Hexadonut Charts will add a touch of elegance to your presentation while making your data more comprehensible for your audience.
The Hexadonut Chart consists of three data-driven pie charts, each masked by two hexagonal shapes to create the appearance of a hexagon doughnut. Notably, it features a hexagon-shaped outer ring with a hexagon cut-off part in the center. Each pie can illustrate a single percentage number, displayed prominently in the center of the hexagon doughnut chart. Consequently, the three charts allow you to effortlessly compare results, enhancing your data analysis and presentation capabilities.
Hexadonut Charts serve as a versatile tool for various presentation scenarios. They excel at comparing percentages, ratios, or shares across different categories or segments. By displaying data in an aesthetically pleasing format, you can capture your audience’s attention and facilitate their understanding of complex information. Furthermore, the editable, data-driven nature of the charts enables you to easily update and tailor the content, ensuring seamless integration into your presentation.
The data-driven Hexadonut Charts are ideal for a wide array of topics, for example encompassing business, finance, marketing, sales, and more. Utilize them to showcase market share comparisons, sales performance metrics, customer satisfaction ratings, or even project completion percentages. As a matter of fact, the versatility of these charts renders them suitable for virtually any subject requiring data comparison and analysis.
In conclusion, incorporating the data-driven Hexadonut Charts for PowerPoint and Google Slides into your next presentation is a surefire way to captivate your audience and convey data effectively. Don’t miss the opportunity to enhance your presentation prowess with these sleek and professional charts. Download your free Hexadonut Charts today and experience the difference they can make!
Usage instructions:
- PowerPoint: Just right-click the chart to edit the data series, and select “Edit Data” (twice):

Shapes are 100% editable: colors and sizes can be easily changed.
Includes 2 slide option designs: Standard (4:3) and Widescreen (16:9).
Widescreen (16:9) size preview:
This ‘Hexadonut Charts’ template features:
- 2 unique slides
- Light and Dark layout
- Ready to use template with text placeholders
- Completely editable shapes
- Data-driven pie charts
- Standard (4:3) and Widescreen (16:9) aspect ratios
- PPTX file (PowerPoint) and optimized for Google Slides
Free fonts used:
- Helvetica (System Font)
- Calibri (System Font)


