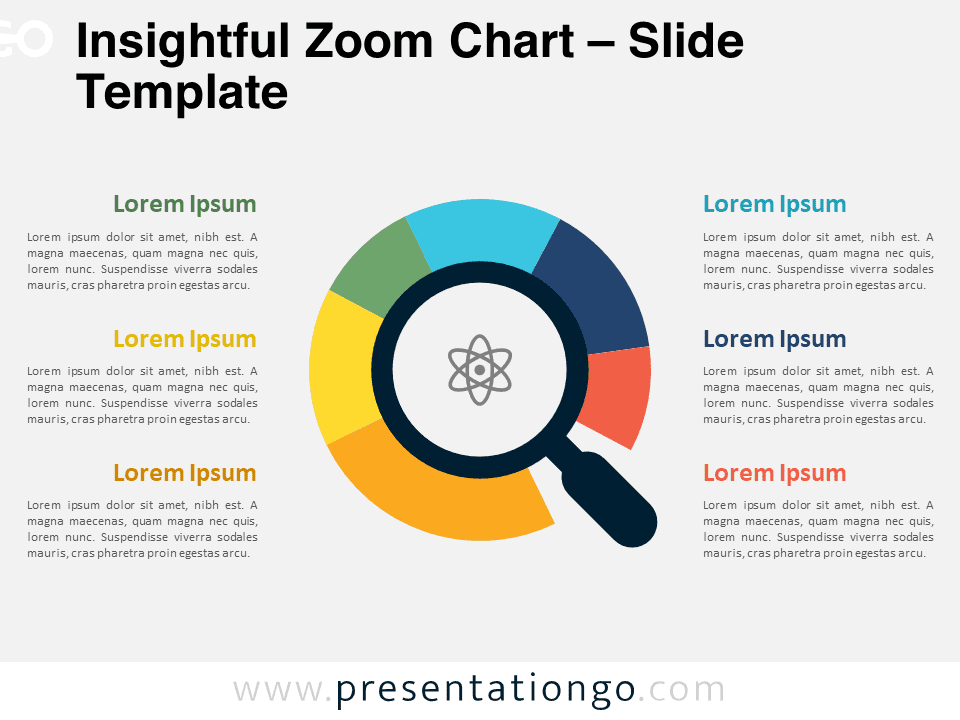
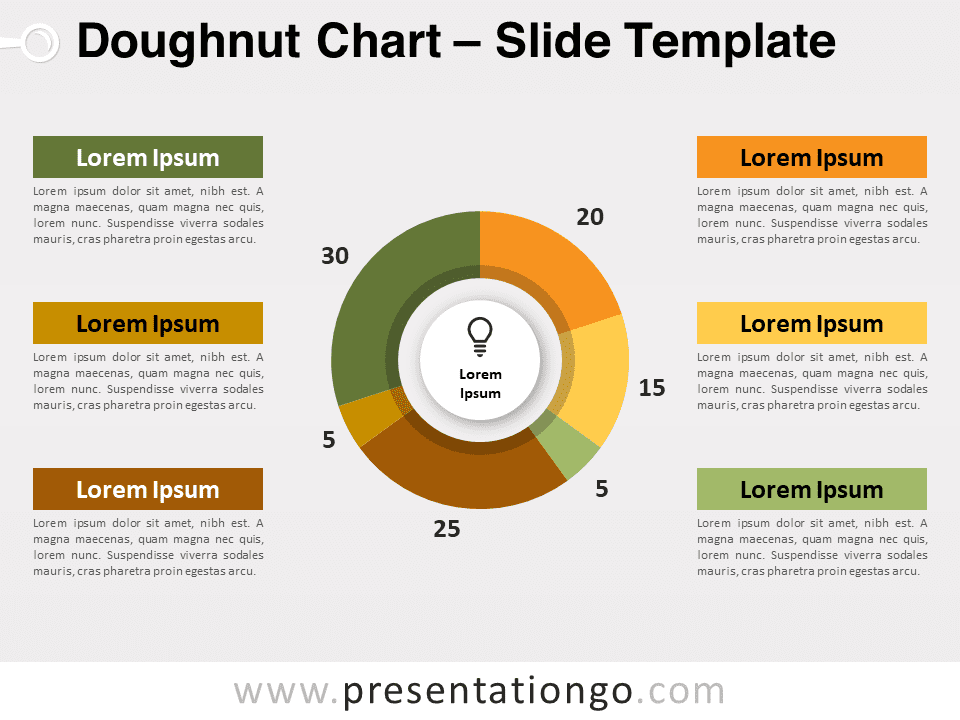
The Insightful Zoom Chart for PowerPoint presents a data-driven doughnut pie chart with a central magnifying glass, ideal for displaying detailed analytical insights.
Customizable Doughnut Chart for Data-Driven Insights
This template features a segmented circular chart with distinct color-coded sections, each representing different data categories or conceptual elements. The centerpiece is a magnifying glass overlay, symbolizing focused analysis or scrutiny of specific data points. The chart’s design allows for easy customization, enabling users to modify data and instantly visualize changes. Its clean layout and vibrant color scheme enhance data differentiation and quick comprehension.
Pie charts are a powerful way to visualize proportions and relationships within data, often used to illustrate percentages or parts of a whole. In presentations, they can simplify complex data sets and make the information more digestible for the audience. The Insightful Zoom Chart is particularly beneficial for users needing to update data frequently, such as in sales reports, project updates, or market analyses. By providing a dynamic visual representation of data, this template helps users present their findings more compellingly and clearly. For example, a marketing professional could use the chart to display survey results, while a project manager might show progress across different project phases.
The template includes two unique slides, pre-populated with icons and text placeholders. It offers fully customizable shapes, a data-driven pie chart for dynamic representation, and options for light and dark themes. The presentation is available in both Standard (4:3) and Widescreen (16:9) ratios, provided in PowerPoint PPTX format for maximum compatibility and ease of use.
Download this versatile PowerPoint template to transform your data presentations into compelling visual narratives.
Widescreen (16:9) size preview:
This template offers:
- 2 unique slides
- Options for both light and dark themes
- Pre-populated with icons and text placeholders
- Fully customizable shapes for complete control
- Data-driven pie-chart for dynamic data representation
- Available in both Standard (4:3) and Widescreen (16:9) ratios
- Offered in both PowerPoint PPTX and Google Slides formats


