Free gear pie chart for PowerPoint and Google Slides. A gear-doughnut infographics combo for your quantitative results. Editable graphics with text placeholders.
Gear Pie Chart
Get your slides to the next level and move through the gears! This free Gear Pie Chart template offers a unique design for you to illustrate your data. Your presentation will run like clockwork!
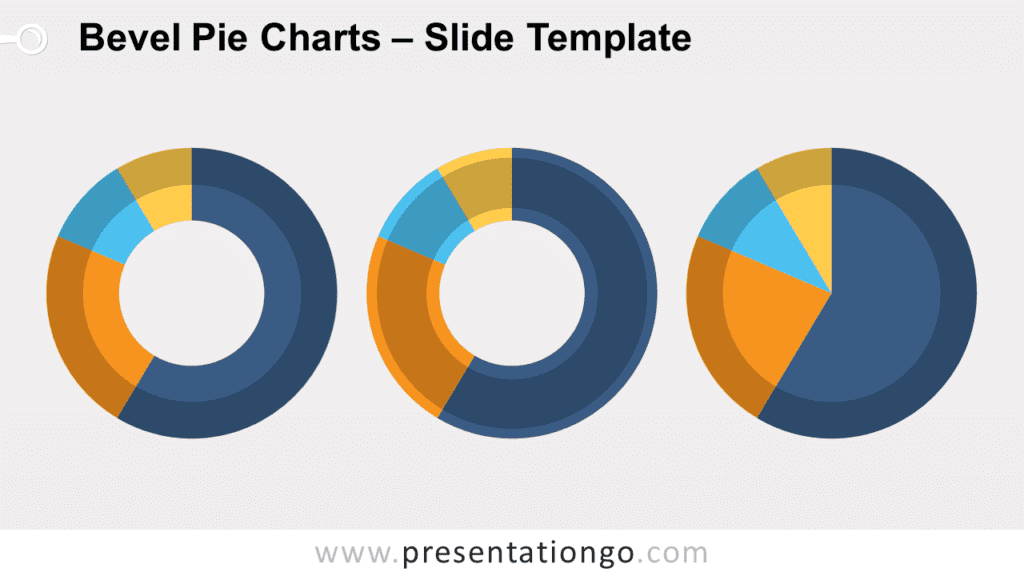
This original slide shows 3 interlocked gear wheels. The central one is larger than the other two. These 3 wheels have a circular shape that contains a pie chart. You can indeed include 4 circular sections of different colors. Besides, and most importantly, the pie charts are data-driven, which means that you can easily update the graphics with your data. You also have the possibility to write a title for each wheel. There is a text box to name each one of the 4 sections or your doughnut charts. Finally, you can find two versions of this slide: one with a white background and another with a dark one.
This free Gear Pie Chart template is a great tool for data visualization. Indeed, it allows you to illustrate your numbers in a clear visual way and compare them easily.
Shapes are 100% editable: colors and sizes can be easily changed.
Includes 2 slide option designs: Standard (4:3) and Widescreen (16:9).
Widescreen (16:9) size preview:


This ‘Gear Pie Chart’ template features:
- 2 unique slides
- Light and Dark layout
- Ready to use template with text placeholders
- Completely editable shapes
- Data-driven (doughnut) pie charts
- Standard (4:3) and Widescreen (16:9) aspect ratios
- PPTX file (PowerPoint) and for Google Slides
Free fonts used:
- Helvetica (System Font)
- Calibri (System Font)