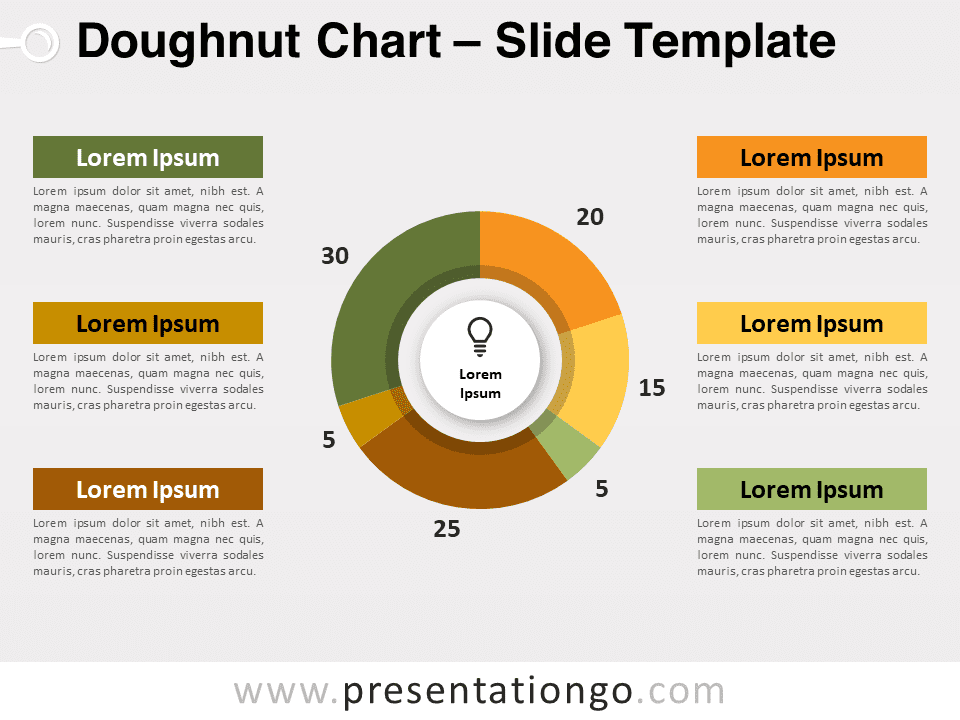
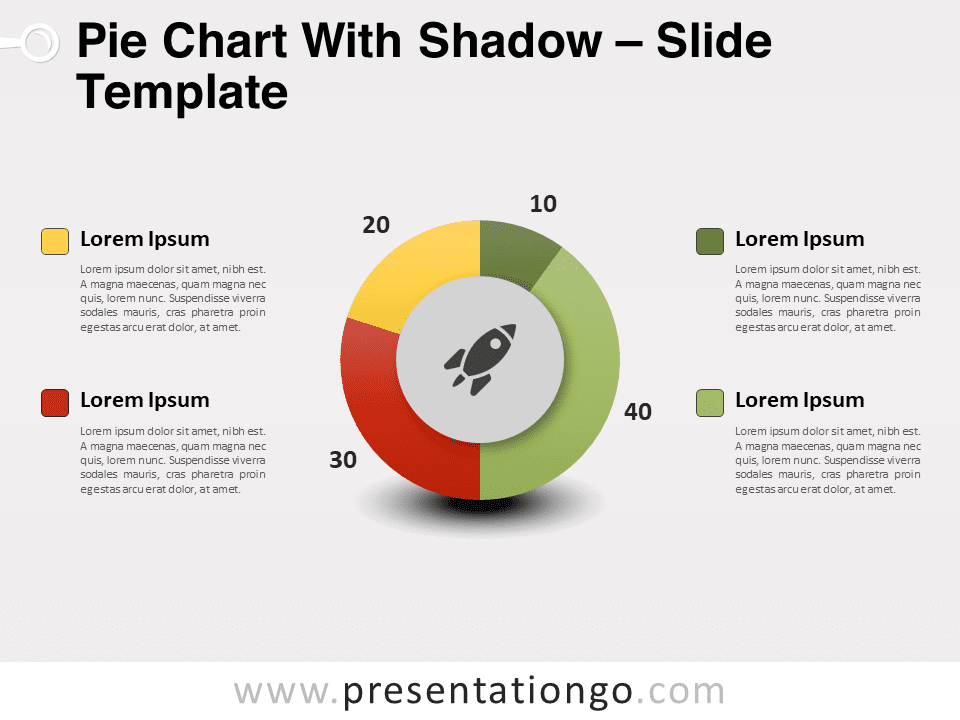
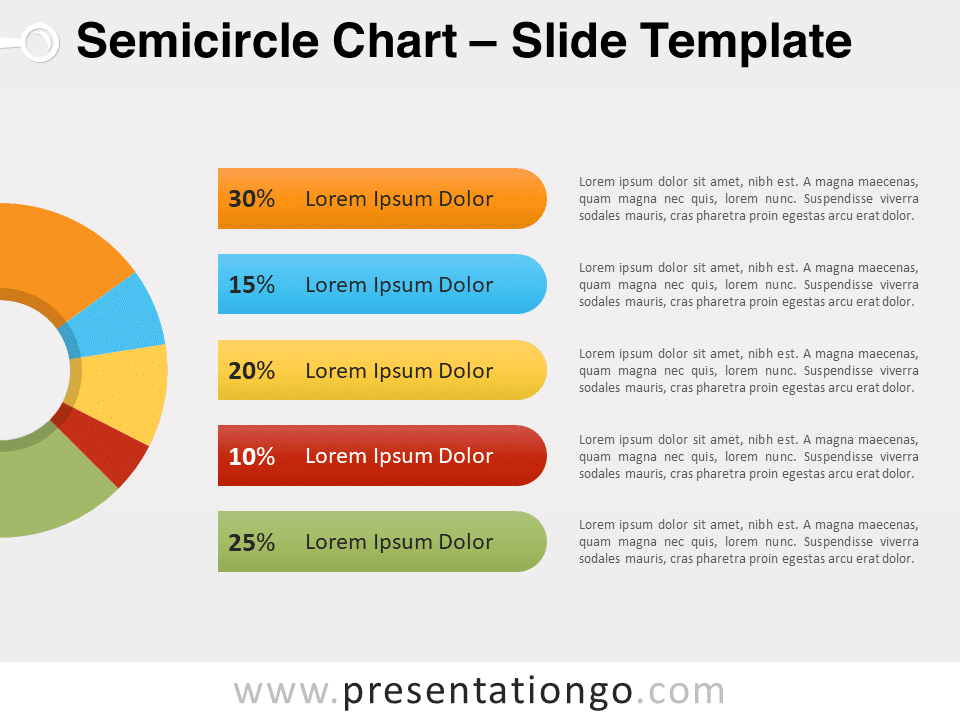
Elevate your presentations with our Modern Doughnut Charts for PowerPoint, a design masterpiece tailored to showcase data with clarity and style. These charts serve as a powerful tool for visualizing information with data, ensuring your key points are communicated effectively and efficiently.
Modern Doughnut Charts
Discover the exceptional functionality of our Modern Doughnut Chart templates, designed for PowerPoint and Google Slides. These charts stand out with their dynamic, data-driven doughnut charts that update instantly with new data inputs. Experience real-time data visualization to keep your audience informed with the latest information.
Our designs are not only efficient but also aesthetically pleasing. They come with editable shapes and easy-to-replace icons from the Office library, allowing you to tailor each chart to fit your presentation’s unique brand and theme.
Our Modern Doughnut Chart templates are ingeniously crafted pie charts with an editable circular cutout at their core. This clever feature allows data labels to be dynamically positioned outside the chart area (for the PowerPoint version), a functionality not typically available with standard doughnut charts. This enhances readability and maintains the aesthetic quality of your presentation, ensuring clear data communication without sacrificing style.
These charts are versatile, perfect for various presentation needs—be it financial analysis, sales insights, or marketing statistics. Marketers can effectively showcase social media engagement metrics, while project managers can illustrate task allocations in teams. The ease of data manipulation in these charts makes them invaluable for presenting complex information in an understandable manner.
In summary, our Modern Doughnut Charts offer a perfect fusion of style and utility. They are essential tools for presenters, enabling customization and dynamic data representation. With their polished design, these charts don’t just present data; they engage and inspire your audience. Elevate your presentations with these charts to deliver your message powerfully and professionally.
Widescreen (16:9) size preview:
This ‘Modern Doughnut Charts’ template offers:
- 6 unique slides
- Light and Dark layout
- Ready to use template with icons and text placeholders
- Completely editable shapes
- Data-driven pie charts
- Standard (4:3) and Widescreen (16:9) aspect ratios
- PPTX file (PowerPoint) and optimized for Google Slides
Free fonts used:
- Helvetica (System Font)
- Calibri (System Font)


