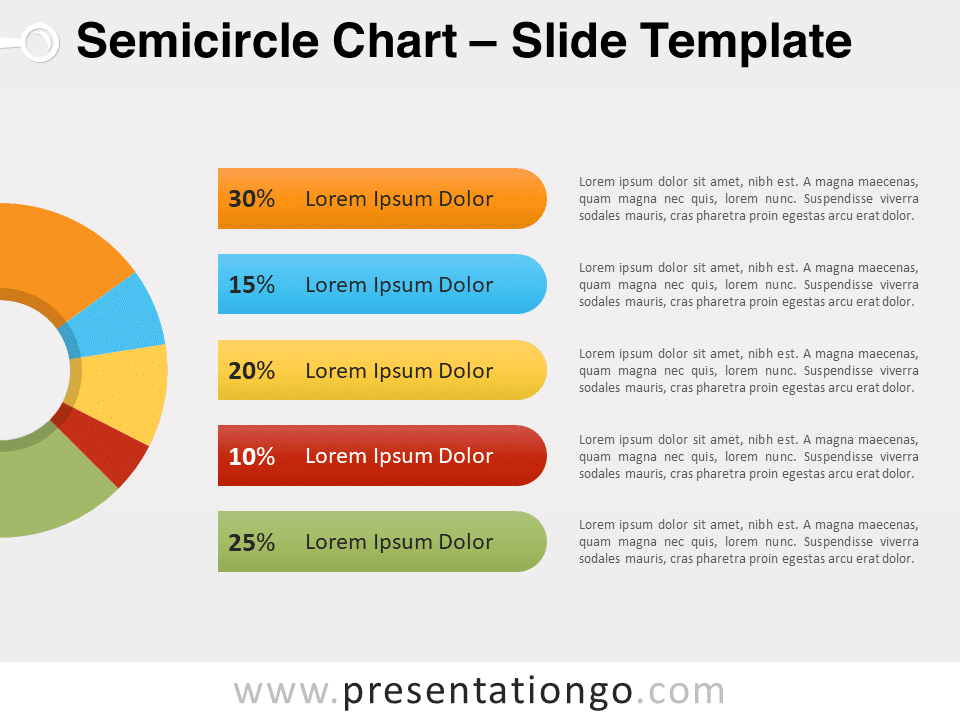
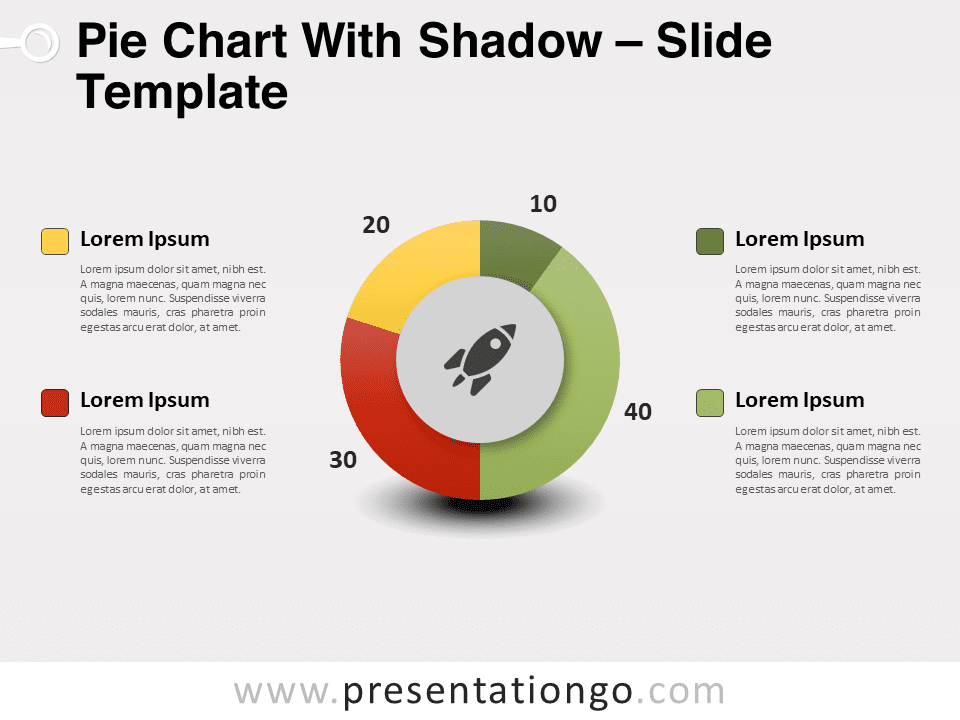
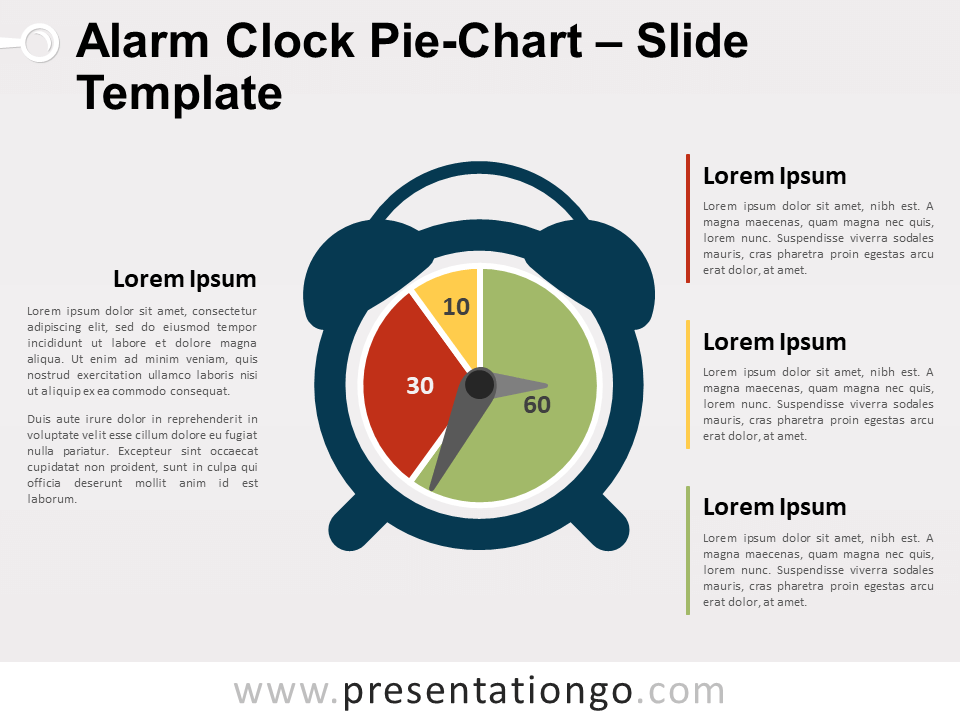
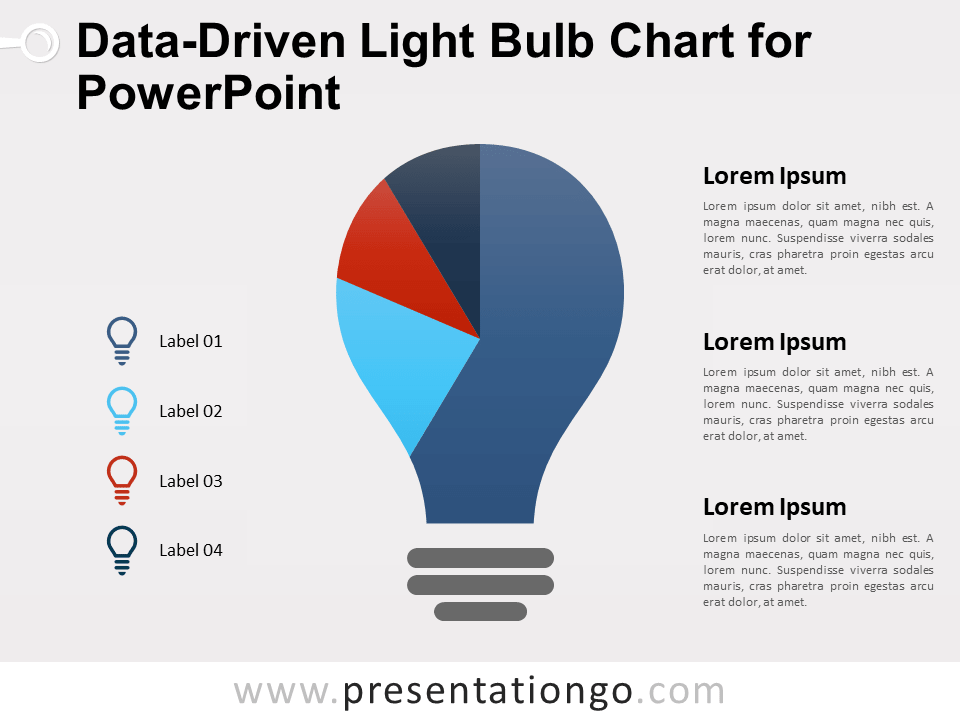
The Semicircle Chart Template for PowerPoint and Google Slides offers a visually striking, data-driven design to clearly present information in presentations. With customizable chart segments matched to descriptive labels, this unique layout allows speakers to associate data trends with explanatory text.
Present Ideas With Compelling Data Visualization
As a data-driven chart, users can input their own figures into the template to auto-populate the semicircle graphic segments. This functionality ensures the chart always reflects real data being presented. The color-coded chart sections correspond to centered text boxes that include placeholders for descriptive labels explaining each data point. For additional details, extra text boxes beside each label allow presenters to elaborate on the key takeaways. The fully editable shapes and colors enable further customization based on preference and branding needs.
This semicircle chart layout works well for displaying progress to goals, budget allocated across departments, market share dominated by brands, or any category comparisons supported by actual data. For instance, a sales manager could showcase year-to-date performance versus annual targets in the chart, using the labels to call out achievements or shortfalls for the respective quarters. Non-profits may track fundraising amounts raised by source, commenting on which outreach strategies are proving most fruitful. The data visualization aspect helps simplify complex data correlations, while the explanatory text connects the dots for audiences.
With its aesthetic design, built-in data functionality, and flexible text components, the Semicircle Chart Template simplifies presenting information in an impactful way. Allowing speakers to translate data into compelling visual stories, this multipurpose slide can become a versatile tool for any presenter looking to clearly communicate key information to audiences. Inserting real figures into the graphic and customizing the surrounding text to match the narrative empowers impactful data visualization for presentations.
Widescreen (16:9) size preview:
This ‘Semicircle Chart’ template features:
- 2 unique slides
- Options for both light and dark themes
- Pre-populated with icons and text placeholders
- Fully customizable shapes for complete control
- Data-driven pie-chart for dynamic data representation
- Available in both Standard (4:3) and Widescreen (16:9) ratios
- Offered in both PowerPoint PPTX and Google Slides formats


