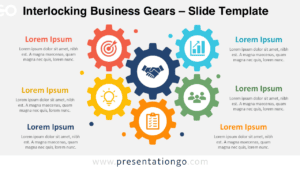
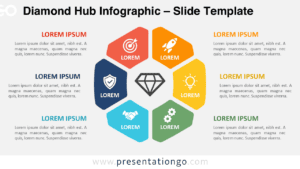
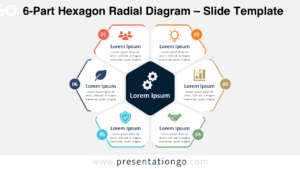
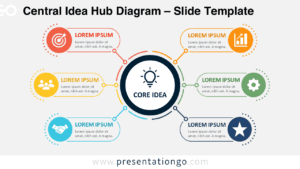
The Honeycomb Cluster Diagram offers a clear way to present related ideas around one central concept. Its interlocking hexagons create a compact structure that feels organized without becoming rigid. The layout works especially well when several topics share equal importance. It also helps viewers understand how separate elements contribute to a broader theme.
The core cluster uses bold hexagonal shapes with short labels and simple visual symbols. Supporting hexagons sit around the main structure and provide room for brief explanations. This arrangement creates a natural hierarchy between primary and secondary information. It also keeps the slide balanced and easy to scan.
Diagram Preview
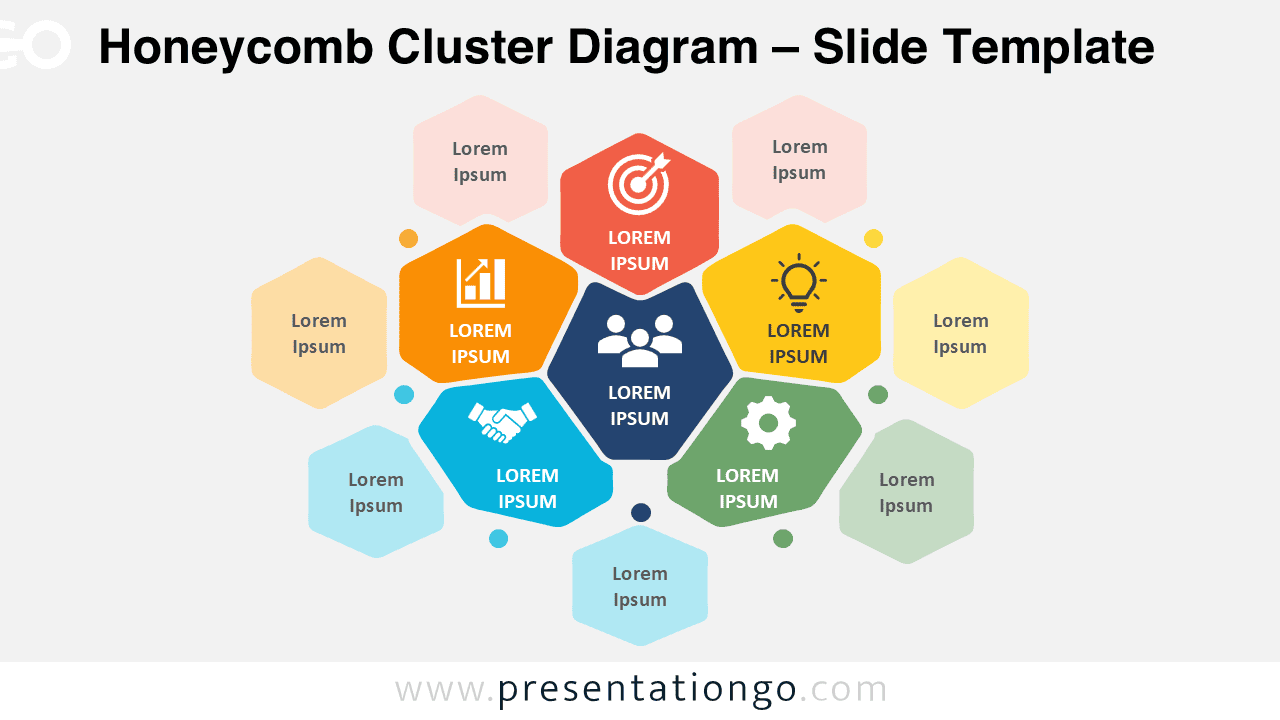
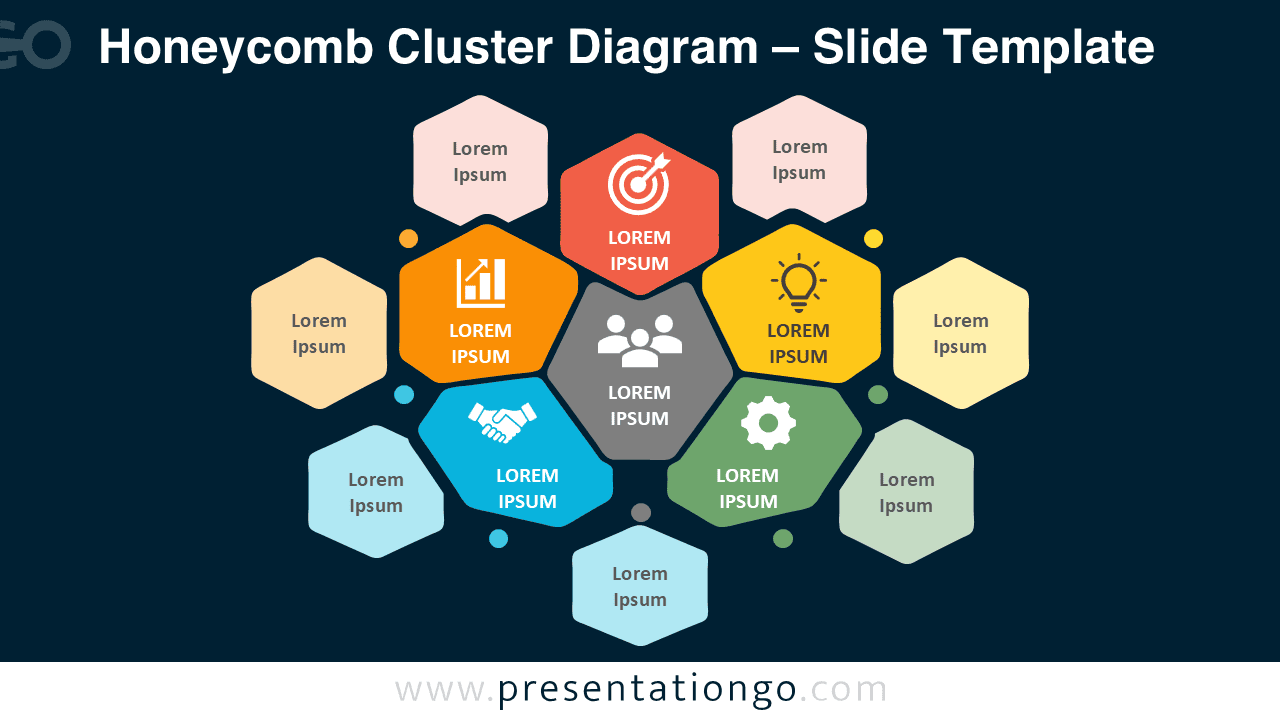
The Honeycomb Cluster Diagram is available in PowerPoint and Google Slides formats. Both versions use editable shapes and text areas. You can adapt the wording, resize the elements, or rearrange the supporting content. The diagram remains visually cohesive even after substantial editing.
Features and Customization Options
- Editable interlocking hexagons
- Customizable text and labels
- Scalable vector-based shapes
- Flexible supporting content areas
- Light and dark slide options
- Icons included for illustration only
- Icons sourced from the Office icon library
- Icons are easy to modify or replace
- Compatible with PowerPoint and Google Slides
Design and Structure
The diagram centers on a tight honeycomb arrangement that keeps connected ideas visually close. Each core hexagon holds a short label and an icon placeholder. The central position can highlight the main subject, while nearby sections represent related themes, functions, or categories.
Lighter supporting hexagons expand the structure without making it feel crowded. They can hold short notes, outcomes, examples, or definitions. Small circular accents reinforce the relationship between the main cluster and the surrounding content.
The balanced geometry gives the slide a polished and premium appearance. It suits professional presentations while remaining approachable and easy to understand. The design also supports quick reading during meetings, workshops, and classroom discussions.
Practical Applications
- Map related business ideas
- Present product feature groups
- Explain strategic pillars
- Visualize company ecosystems
- Organize team capabilities
- Compare connected departments
- Group research findings
- Show service categories
- Summarize innovation themes
- Build concept maps
Summary
The Honeycomb Cluster Diagram turns interconnected information into a focused visual story. Its compact structure supports clear comparisons and logical grouping. Editable hexagons, concise labels, and flexible supporting areas make it suitable for many topics. Use it to explain relationships, organize ideas, or present a central concept with its surrounding elements.