Free infographic block cycle for PowerPoint and Google Slides. Pie chart with 6 equal parts, a circle shape in the middle. Colorful text blocks connected to the central circle. Editable graphics with numbers, icons, and text placeholders.
Infographic Block Cycle
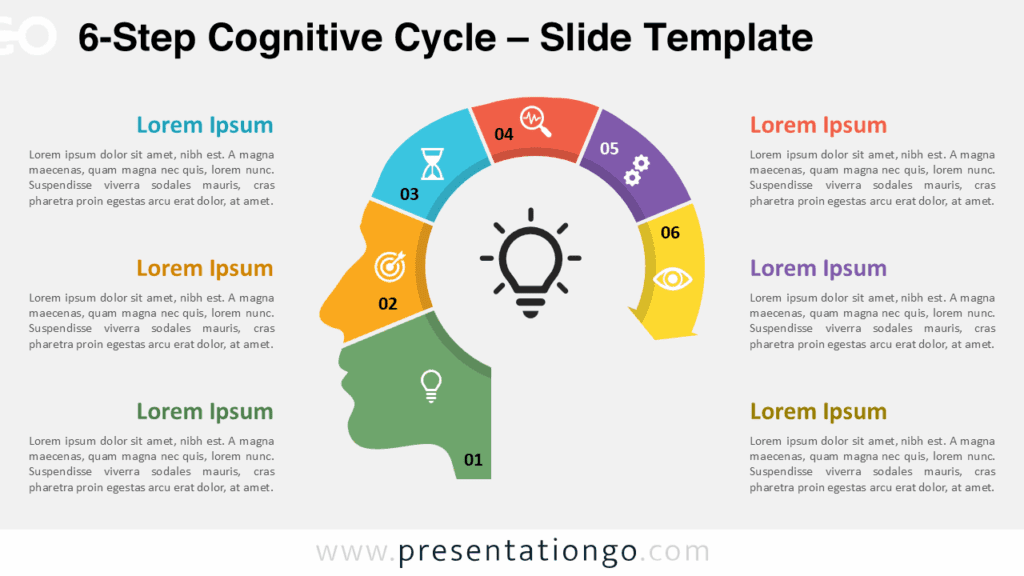
Use this circular diagram to illustrate 6 ideas, concepts, or groups of information.
You can also use it to represent a continuing sequence of 6 stages, tasks, or events in a circular flow.
Additionally, you can use this diagram to show how 6 individual and interconnected parts form a whole. This infographic template will finally be great to illustrate the relationship to a central idea: emphasizes both information in the center diagram and how information in the outer shapes contributes to the central idea in a cyclical progression.
Shapes are 100% editable: colors and sizes can be easily changed.
Includes 2 slide option designs: Standard (4:3) and Widescreen (16:9).
Widescreen (16:9) size preview:


This ‘Infographic Block Cycle for PowerPoint and Google Slides’ document features:
- 2 unique slides
- Light and Dark layout
- Ready to use template with numbers, icons, and text placeholders
- Completely editable shapes
- Uses a selection of editable PowerPoint icons
- Standard (4:3) and Widescreen (16:9) aspect ratios
- PPTX file and for Google Slides
Free fonts used:
- Helvetica (System Font)
- Calibri (System Font)


Comments are closed.