Free infographic organization chart for PowerPoint and Google Slides. Diagram showing the relation of eight (8) banners to a central hexagonal element. Editable graphics with icons and text placeholders.
Infographic Organization Chart
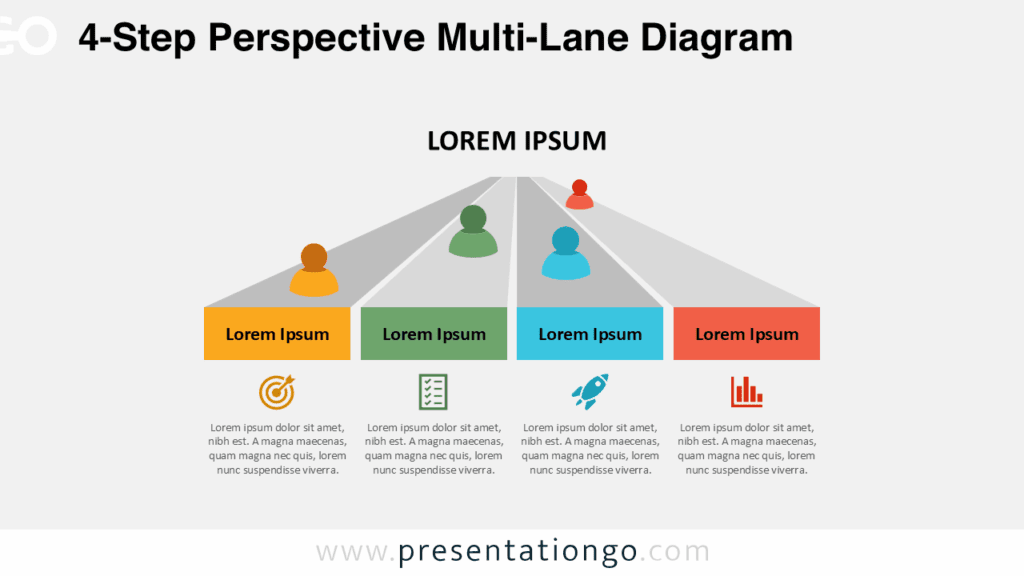
The design illustrates 4 horizontal folded banners with a perspective effect on the left and on the right.
Two sets of groups of information are displayed side by side and connected to the central concept. You can then use it to list 8 different elements, or as well to compare 2 sets of information (left vs. right).
Shapes are 100% editable: colors and sizes can be easily changed.
Includes 2 slide option designs: Standard (4:3) and Widescreen (16:9).
Widescreen (16:9) size preview:


This ‘Infographic Organization Chart for PowerPoint and Google Slides’ features:
- 3 unique slides
- Light and Dark layout
- Ready to use template with icons and text placeholders
- Completely editable shapes
- Uses a selection of editable PowerPoint icons
- Standard (4:3) and Widescreen (16:9) aspect ratios
- PPTX file and for Google Slides
Free fonts used:
- Helvetica (System Font)
- Calibri (System Font)


Comments are closed.