

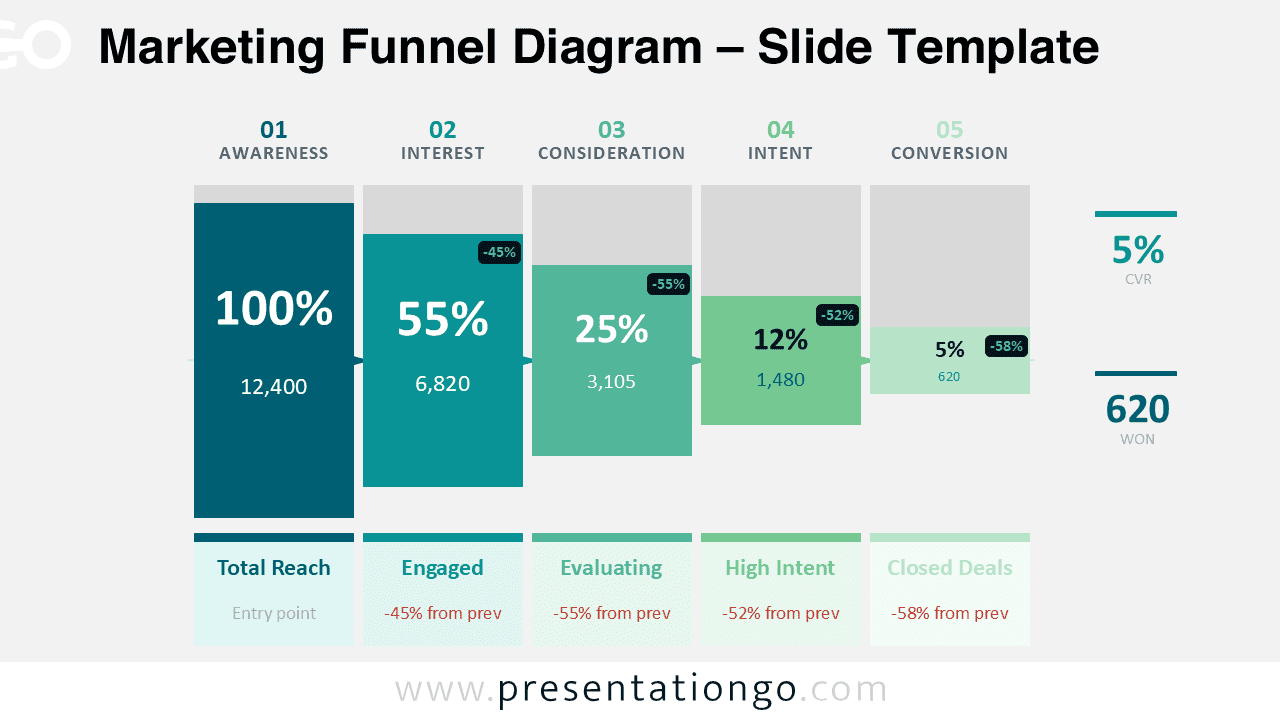
The Marketing Funnel Diagram provides a clear and structured way to present the progression of potential customers through key stages of the marketing and sales journey. From initial awareness to final conversion, this visual layout helps explain how leads move through the funnel and how many prospects are retained or lost at each step.
Designed for PowerPoint and Google Slides, this diagram offers a modern and professional way to visualize marketing performance data. The descending column layout clearly represents the natural narrowing of a funnel, making it easy for audiences to understand conversion rates and customer flow.
Diagram Preview


Features and Customization Options
- Fully editable shapes and text elements
- Compatible with PowerPoint and Google Slides
- Clear five-stage marketing funnel structure
- Multiple color themes included
- Easy to customize values, labels, and percentages
- Professional layout suitable for business presentations
Design and Structure
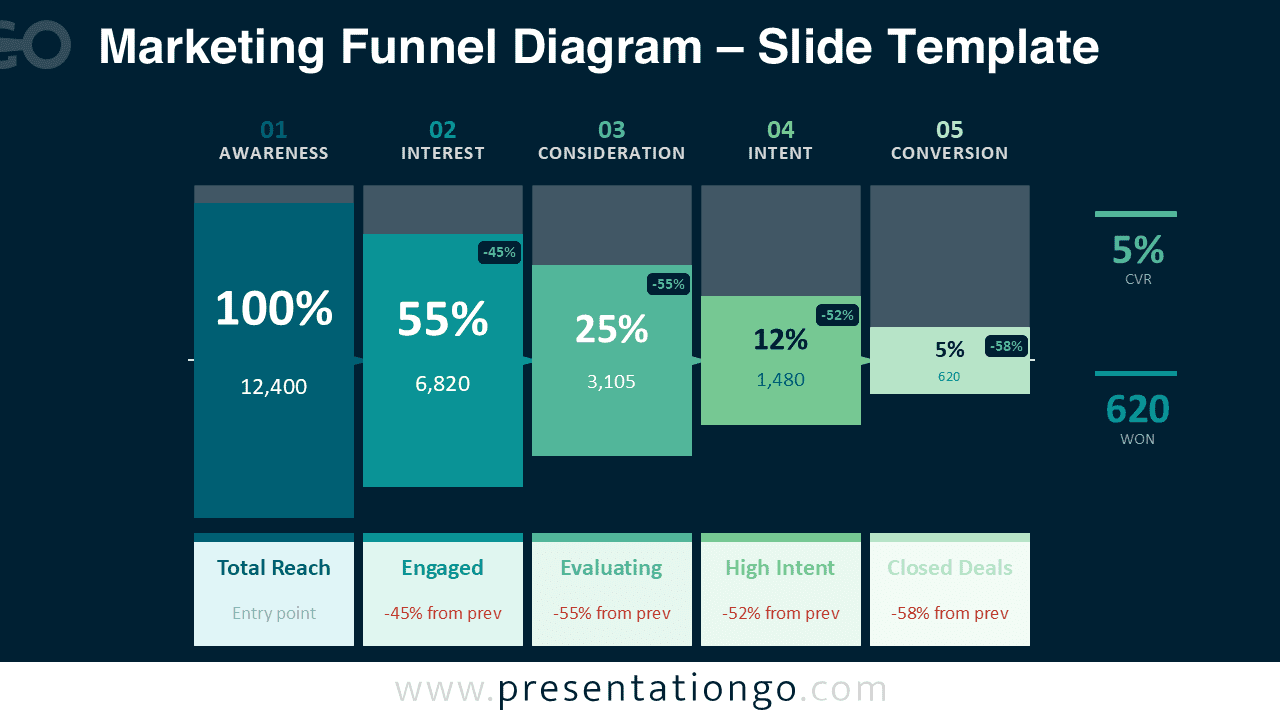
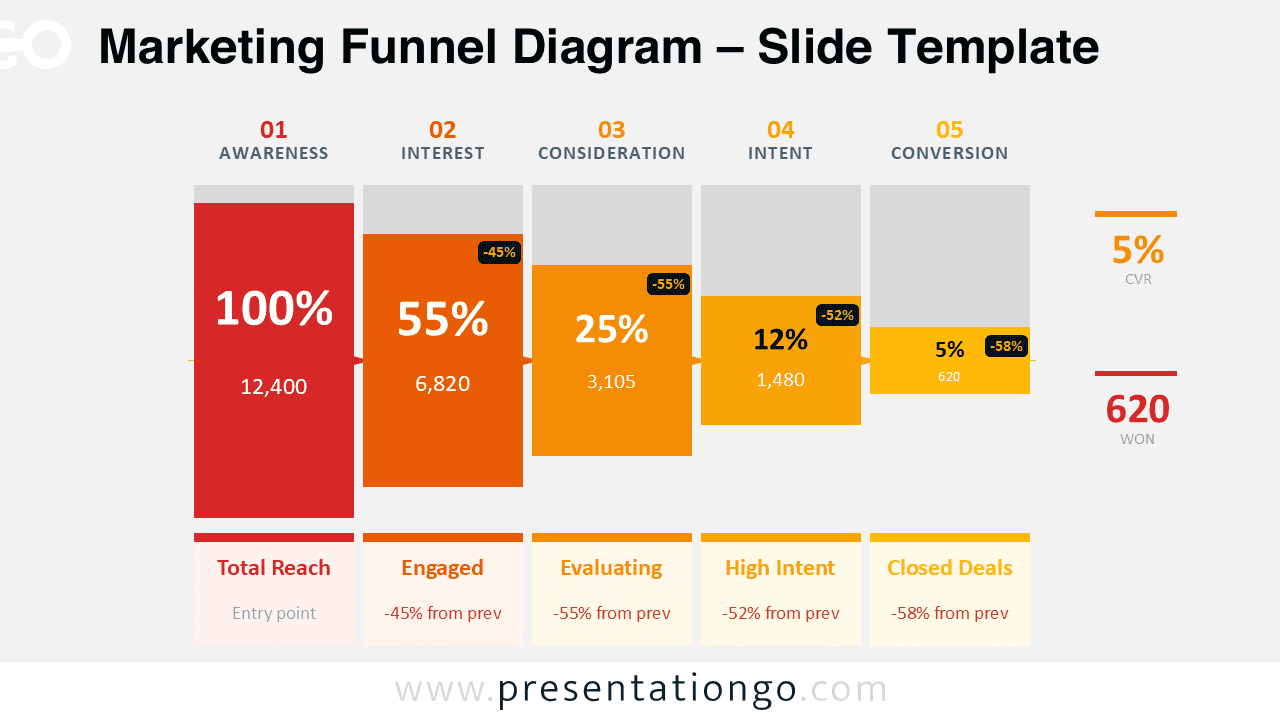
The diagram is built around five key stages of a typical marketing funnel: Awareness, Interest, Consideration, Intent, and Conversion. Each stage is represented by a vertical block that gradually decreases in size to reflect the typical reduction in leads as prospects move through the funnel.
The layout also includes percentage values, total figures, and drop-off indicators between stages. This structure helps presenters explain marketing efficiency, customer engagement levels, and the effectiveness of acquisition strategies.
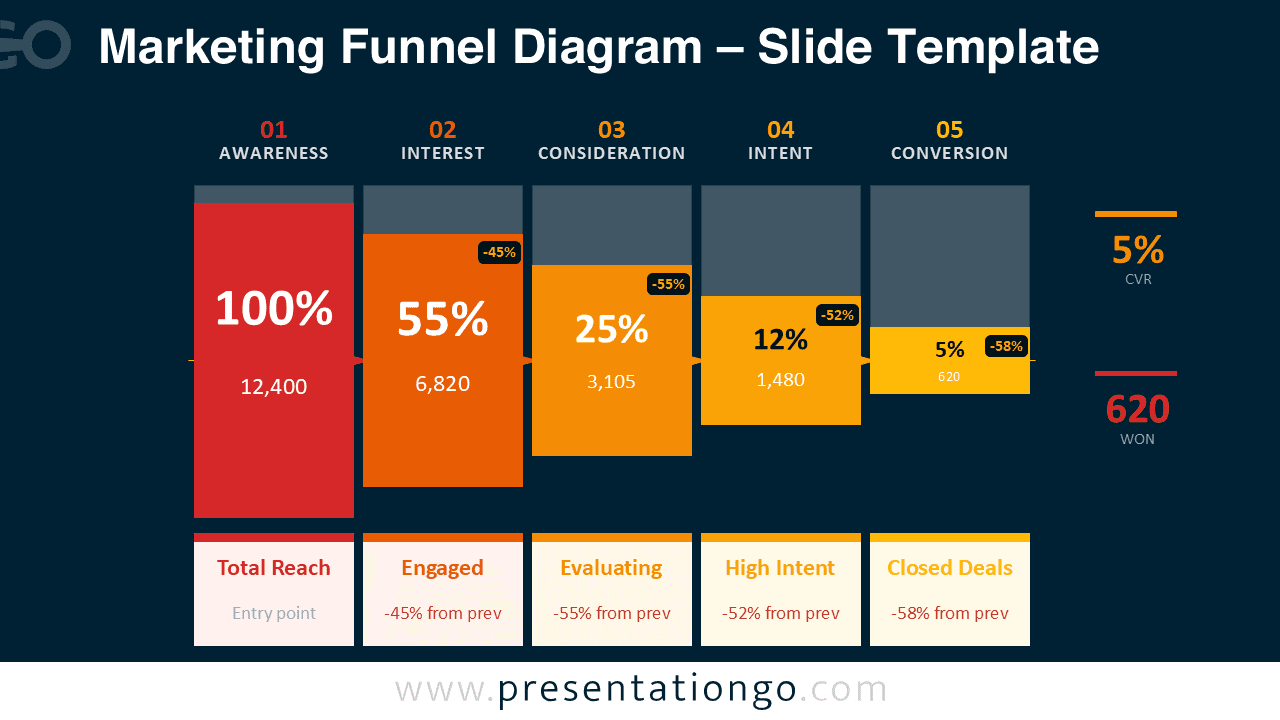
The clean geometric design ensures the information remains easy to read even when presenting complex marketing metrics. Multiple color variations allow the diagram to match different presentation themes or branding styles.
Practical Applications
- Marketing strategy presentations
- Sales pipeline analysis
- Customer acquisition reporting
- Conversion rate optimization presentations
- Startup pitch decks and investor reports
- Digital marketing performance reviews
Summary
The Marketing Funnel Diagram is an effective visual tool for explaining how leads progress through marketing stages and eventually become customers. Its structured layout, clear metrics, and customizable design make it ideal for marketing teams, analysts, and business professionals who need to present funnel performance clearly and professionally.



