The Tunisia Insights Map helps you present geographic information in a clear and structured format. It combines an editable map of Tunisia with practical content areas for explanations, comparisons, and key findings. You can use it in PowerPoint and Google Slides for business reports, educational presentations, government briefings, or regional studies.
The layout gives the map a strong visual role while keeping supporting information easy to follow. Four content blocks organize major points, and a separate callout highlights one essential message. This structure helps audiences connect regional information with your analysis without feeling overwhelmed.
Slide Template Preview
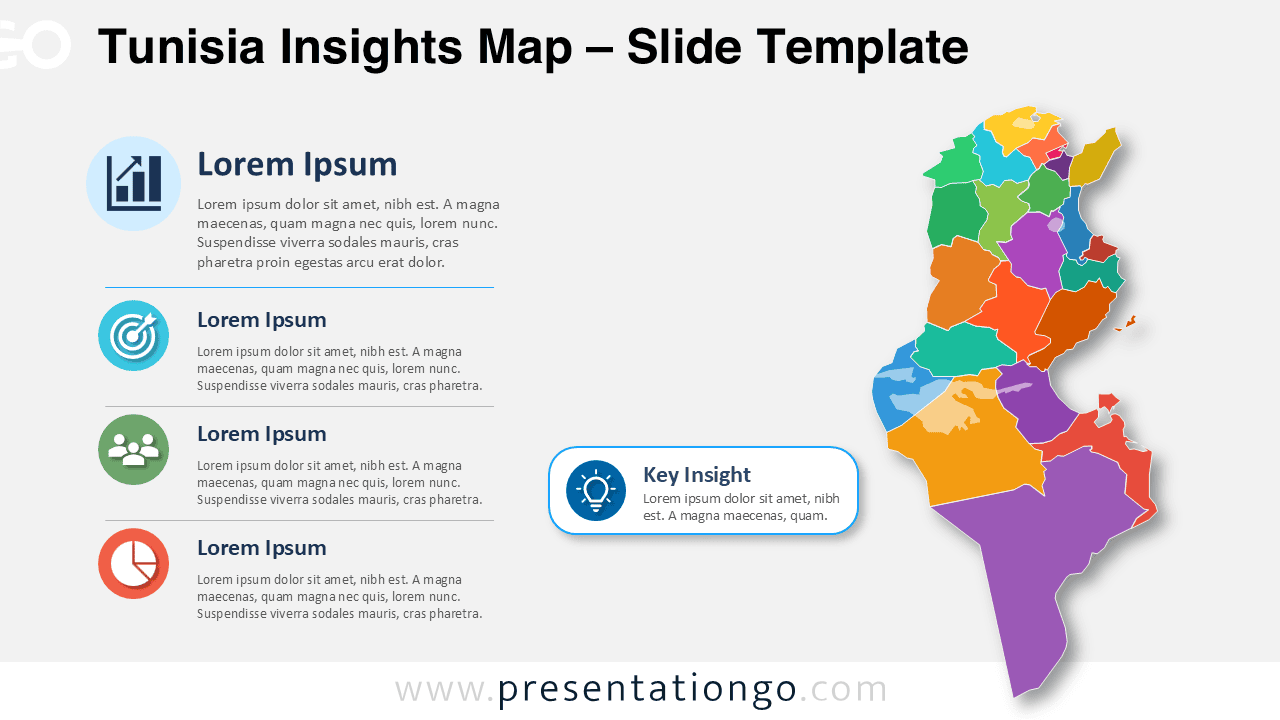
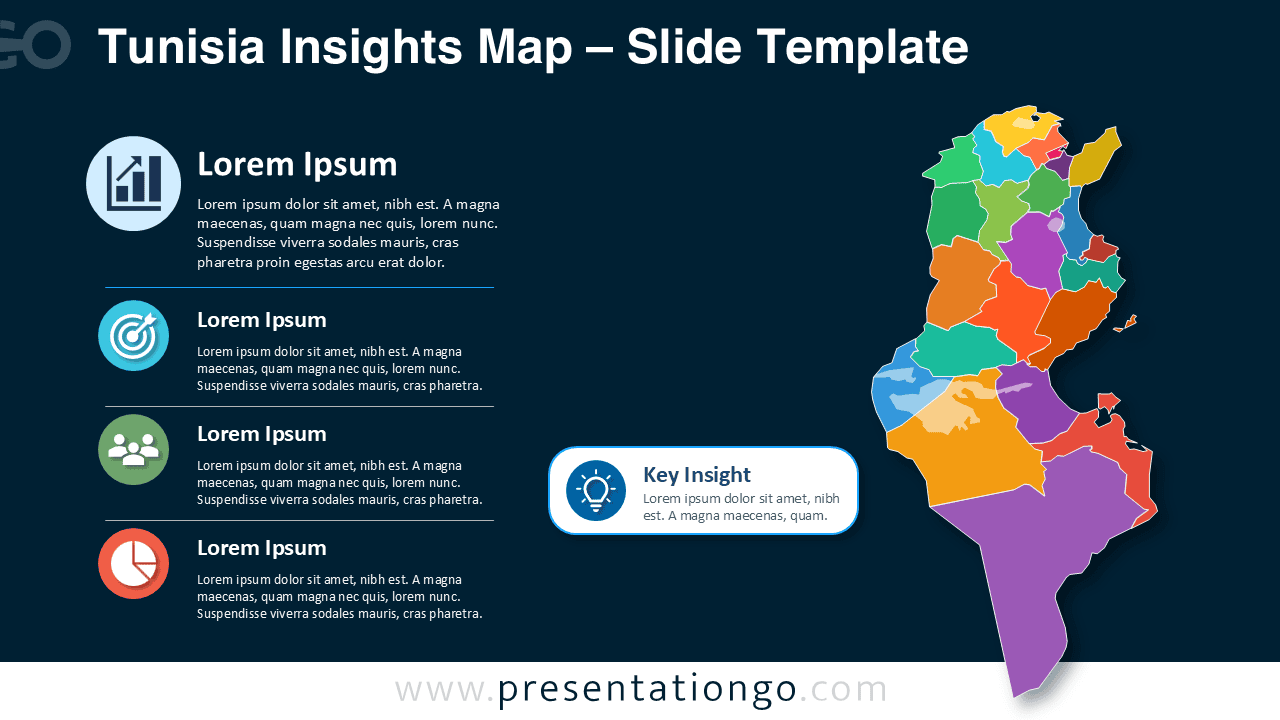


The Tunisia Insights Map includes two presentation-ready versions. Both use the same structure, map details, content blocks, and editable elements. This consistency makes it easy to choose the version that best fits your existing presentation.
Features and Customization Options
- Editable Tunisia map divided into regional areas
- Customizable text, labels, headings, and callouts
- Five structured areas for insights and supporting information
- Icons sourced from the Microsoft Office icon library
- Office icons that are easy to replace, resize, rotate, or modify
- Editable shapes and layout elements
- Compatible with PowerPoint and Google Slides
- Suitable for both detailed reports and concise presentations
Design and Structure
The diagram uses a balanced two-column composition. The left side contains four aligned content sections with icons and short descriptions. The right side features the Tunisia map as the main visual element. A central callout creates an additional focal point for an important conclusion, recommendation, or statistic.
This arrangement supports a natural reading flow. Viewers can scan the key points first, examine the map, and then focus on the highlighted insight. The map regions remain individually editable, so you can emphasize specific governorates or adapt the diagram to your own dataset.
Practical Applications
- Regional market and customer analysis
- Sales territories and distribution planning
- Population and demographic presentations
- Government programs and public policy reports
- Tourism, infrastructure, and development studies
- Education and geography lessons
- Investment and economic presentations
- Research findings and regional comparisons
The Tunisia Insights Map works well when your presentation needs both geographic context and concise interpretation. You can replace the placeholder text with regional statistics, project updates, performance indicators, or strategic recommendations. The editable icons also help you match each section to your topic.
Summary
The Tunisia Insights Map offers a practical way to organize and explain regional information. Its editable map, structured content areas, and flexible Office icons make customization straightforward. Use it in PowerPoint or Google Slides to create focused presentations for business, education, government, research, or planning.