

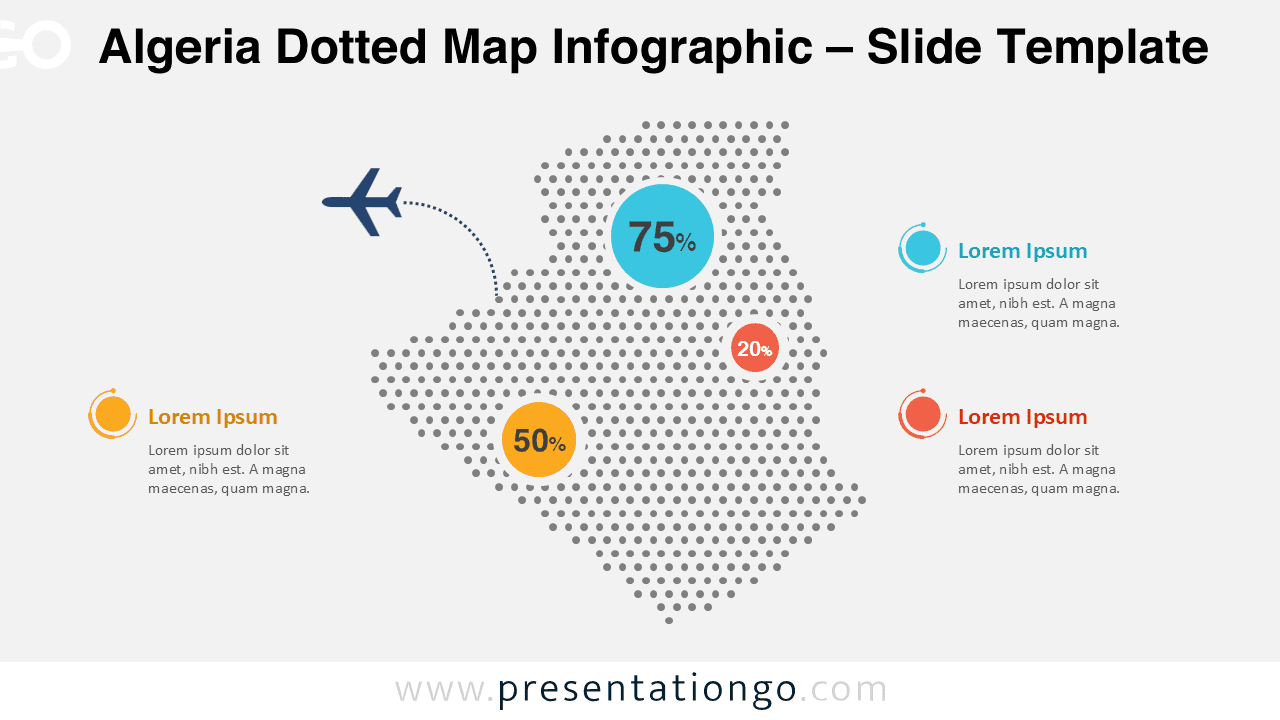
The Algeria Dotted Map Infographic is designed to help you present geographic data and country-level insights in a clear and modern way. This slide offers a dotted representation of Algeria that works well for statistical overviews, regional highlights, and visual storytelling in professional presentations.
The map uses evenly spaced dots to create a recognizable silhouette of Algeria while leaving enough visual space for data markers, labels, and annotations. This approach keeps your slide clean, readable, and easy to customize for different presentation needs.
Map Preview


Features and Customization Options
- Editable dotted map shape with fully customizable layout
- Editable shapes, arrows, and text placeholders
- Includes editable icon placeholders
- Clear percentage markers and callout areas for data emphasis
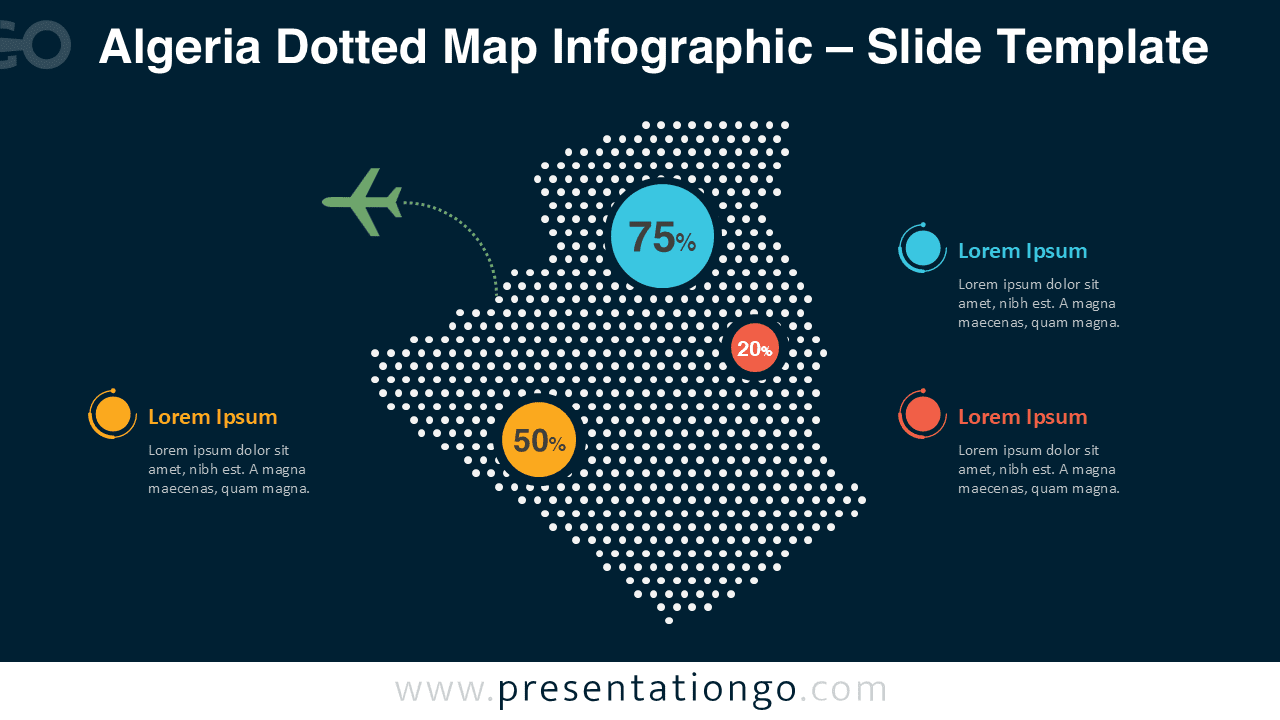
- Light and dark background versions included
- Compatible with PowerPoint and Google Slides
Design and Structure
This dotted map infographic follows a balanced and centered layout that keeps Algeria as the visual focus. Supporting elements are placed around the map to highlight key metrics without overwhelming the slide. The color accents are used selectively to draw attention to important figures while maintaining a professional look.
Both light and dark background versions are included, allowing you to adapt the slide to different presentation themes, screen environments, or branding guidelines. All elements remain fully editable, ensuring visual consistency across your deck.
Practical Applications
- Country-level economic or demographic analysis
- Market research and regional performance presentations
- Educational geography and social studies slides
- Government, NGO, or institutional reports
- Business presentations focused on Algeria or North Africa
Summary
The Algeria Dotted Map Infographic offers a flexible and visually clean solution for presenting geographic information. With editable elements, clear data markers, and compatibility with PowerPoint and Google Slides, it fits seamlessly into a wide range of professional and educational presentations.



