Iran Dotted Map Infographic gives you a clear and professional way to present geographic data in PowerPoint and Google Slides. Use it to highlight travel routes, regional metrics, sales coverage, population figures, or operational reach. The dotted silhouette adds visual interest without making the slide feel crowded. Circular callouts help you direct attention to key numbers quickly, while the route element supports tourism, aviation, transport, and logistics stories.
Map Preview


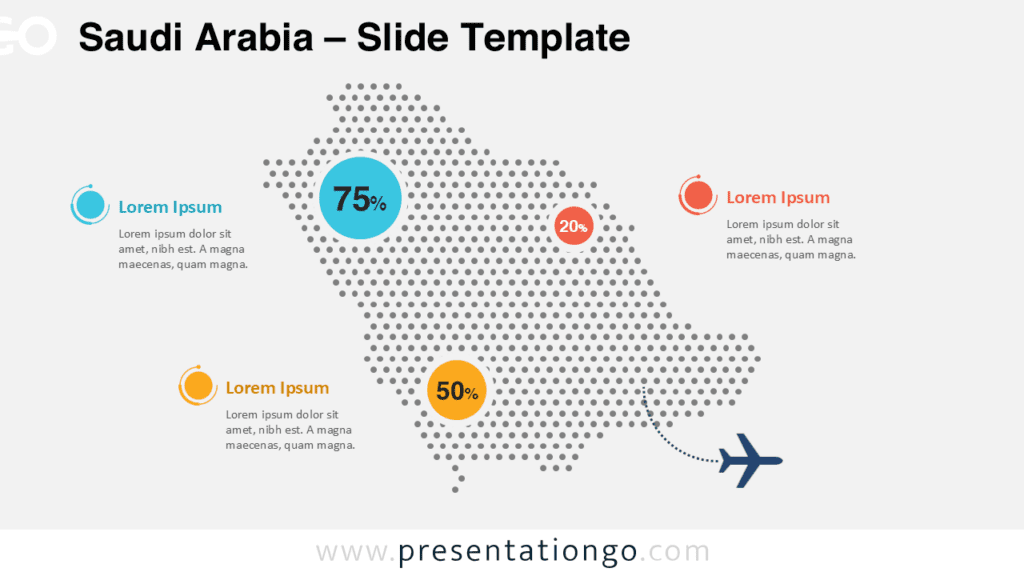
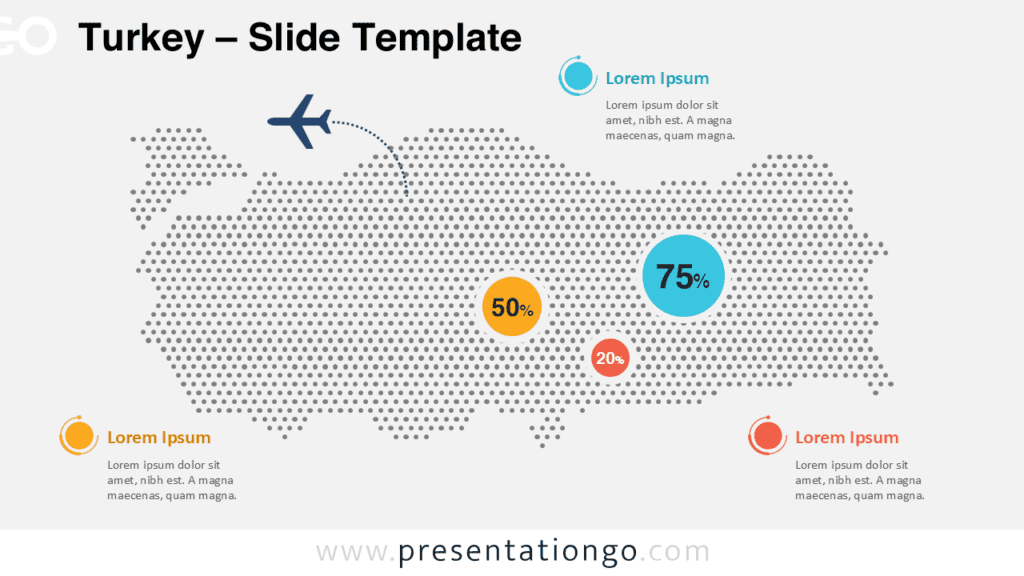
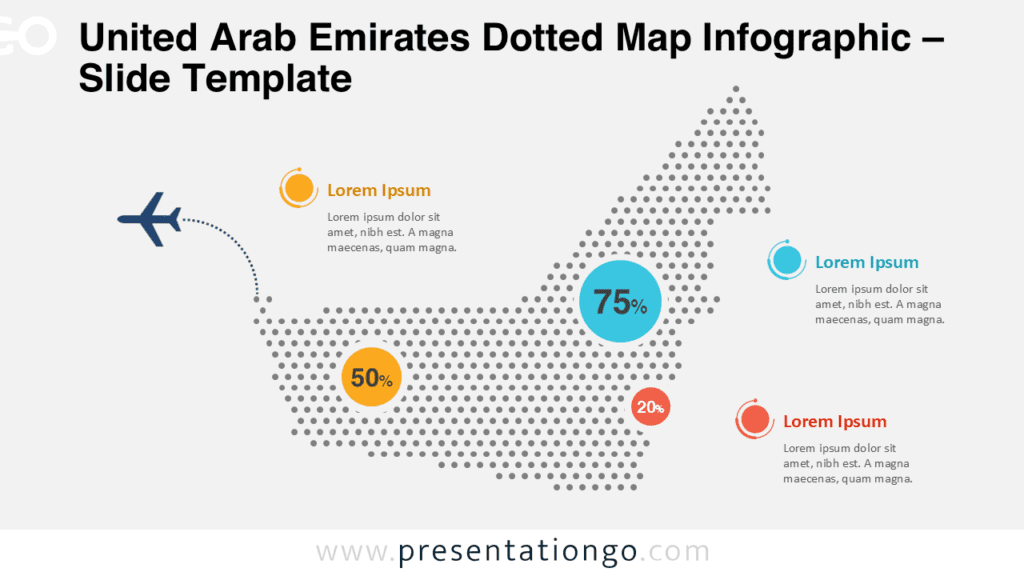
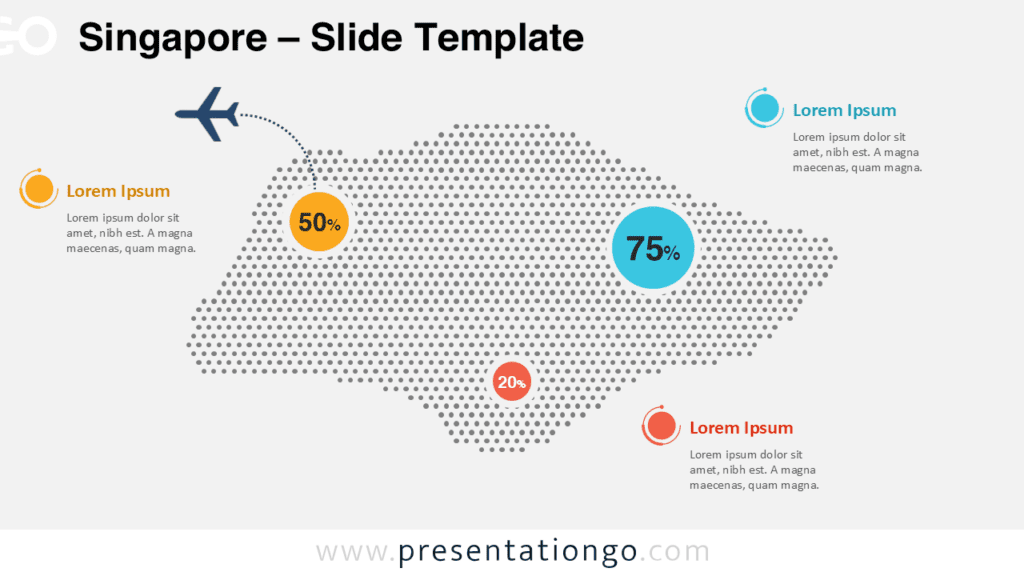
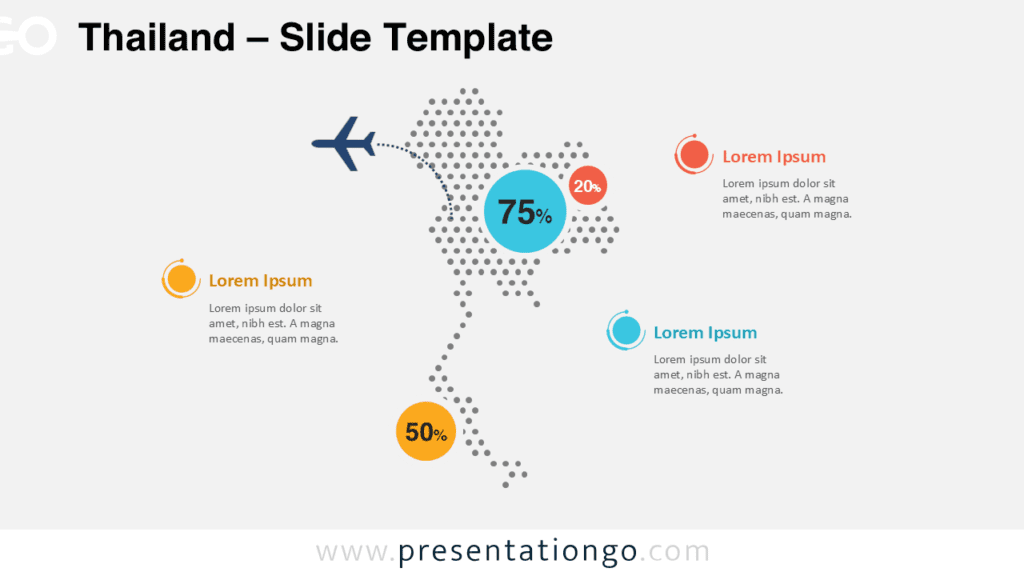
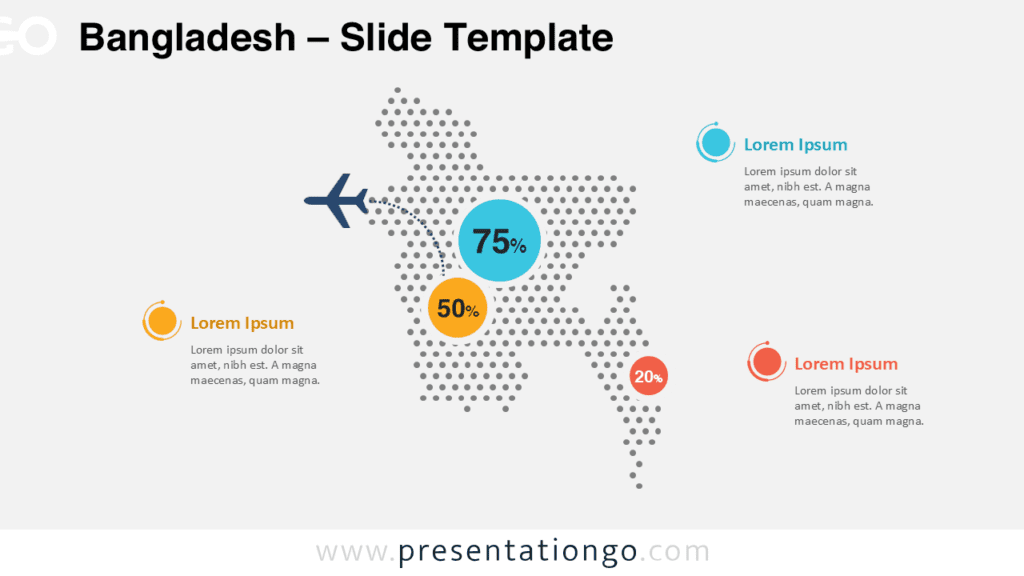
This Iran map slide combines a recognizable country outline with a clean dotted pattern. It creates a modern infographic style while preserving strong geographic context. The composition stays balanced and easy to scan, which helps your audience follow the information without effort. Text blocks sit around the map in a clear structure, and the percentage markers create natural focal points for comparison.
Features and Customization Options
- Editable Iran dotted map layout
- Customizable text, shapes, and percentage markers
- Two ready-to-use versions for different presentation styles
- Clean structure for geographic storytelling
- Suitable for PowerPoint and Google Slides
Design Overview
The design keeps every element purposeful and easy to understand. The dotted shape gives Iran a contemporary infographic look, while the callouts help separate each message clearly. The airplane and curved path introduce movement and narrative value, which makes the slide especially useful for travel, tourism, and route analysis. At the same time, the layout remains flexible enough for business reports, educational content, infrastructure planning, and regional comparisons.
Because the hierarchy is consistent, you can adapt the slide to many topics without changing its structure. You can replace the sample values, edit the text, duplicate markers, or simplify the composition based on your content. This flexibility makes the infographic useful for both quick overviews and more detailed regional presentations.
Practical Applications
- Tourism and travel presentations
- Logistics and transportation reports
- Regional sales and market coverage updates
- Economic or demographic overviews
- Education and geography lessons
Summary
Iran Dotted Map Infographic helps you turn location-based information into a polished visual story. It is easy to edit, simple to read, and flexible across many topics. Use it when you need an Iran map that looks modern and communicates data with clarity in PowerPoint and Google Slides.