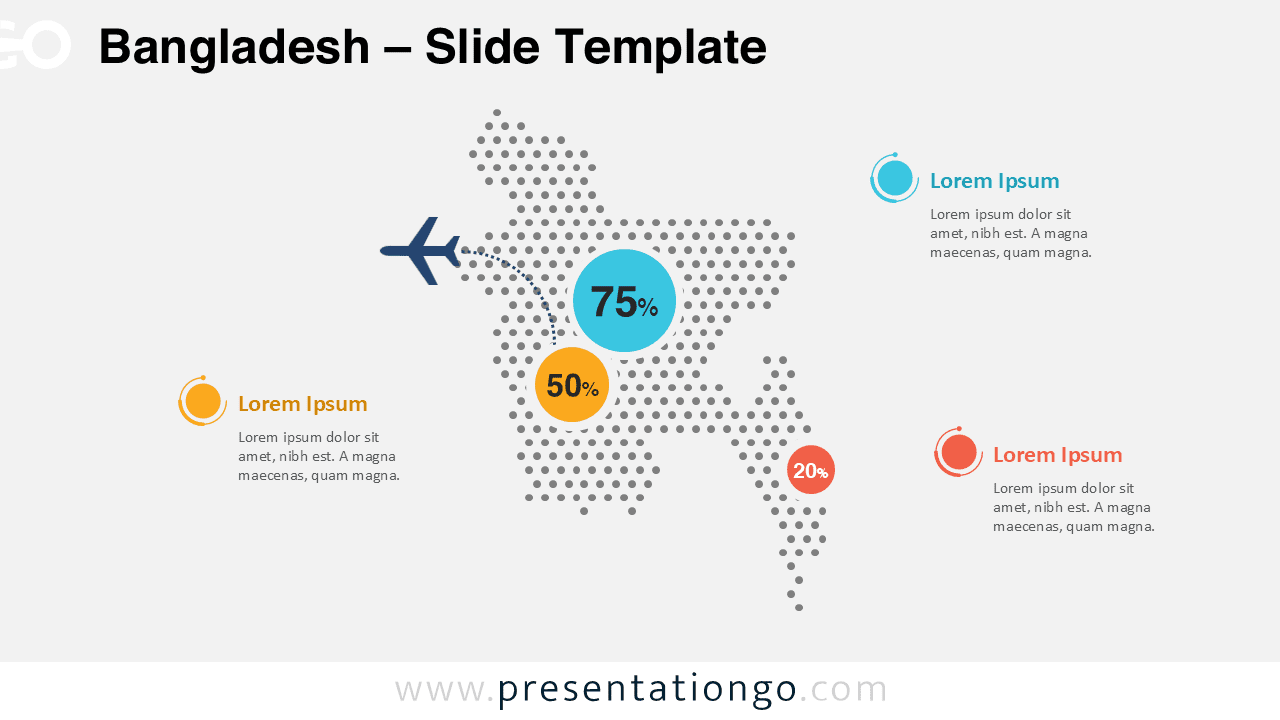
The Bangladesh Dotted Map Infographic provides a clean and modern way to present geographic data in PowerPoint and Google Slides. This visual layout uses evenly spaced dots to form the recognizable silhouette of Bangladesh, creating a stylish and professional data visualization tool for presentations.
This infographic slide helps presenters highlight regional statistics, geographic insights, or business data connected to Bangladesh. The dotted design keeps the map simple and elegant while allowing key information to stand out clearly through percentage indicators and callout areas.
Map Preview


Features and Customization Options
- Editable Bangladesh dotted map built with vector shapes
- Compatible with both PowerPoint and Google Slides
- Light and dark background versions included
- Color-coded percentage markers for highlighting data
- Fully customizable text placeholders and callout areas
- Clean layout designed for geographic and statistical presentations
Design and Structure
The infographic features a dotted map layout representing Bangladesh. The map shape is built from evenly distributed circular elements, giving the design a contemporary and data-focused appearance. Several highlighted markers display key percentages or statistics, making it easy to emphasize important insights.
Additional text blocks around the map provide space for explanations, supporting information, or contextual notes. The composition ensures strong visual hierarchy, guiding the audience’s attention from the main metric to secondary data points.
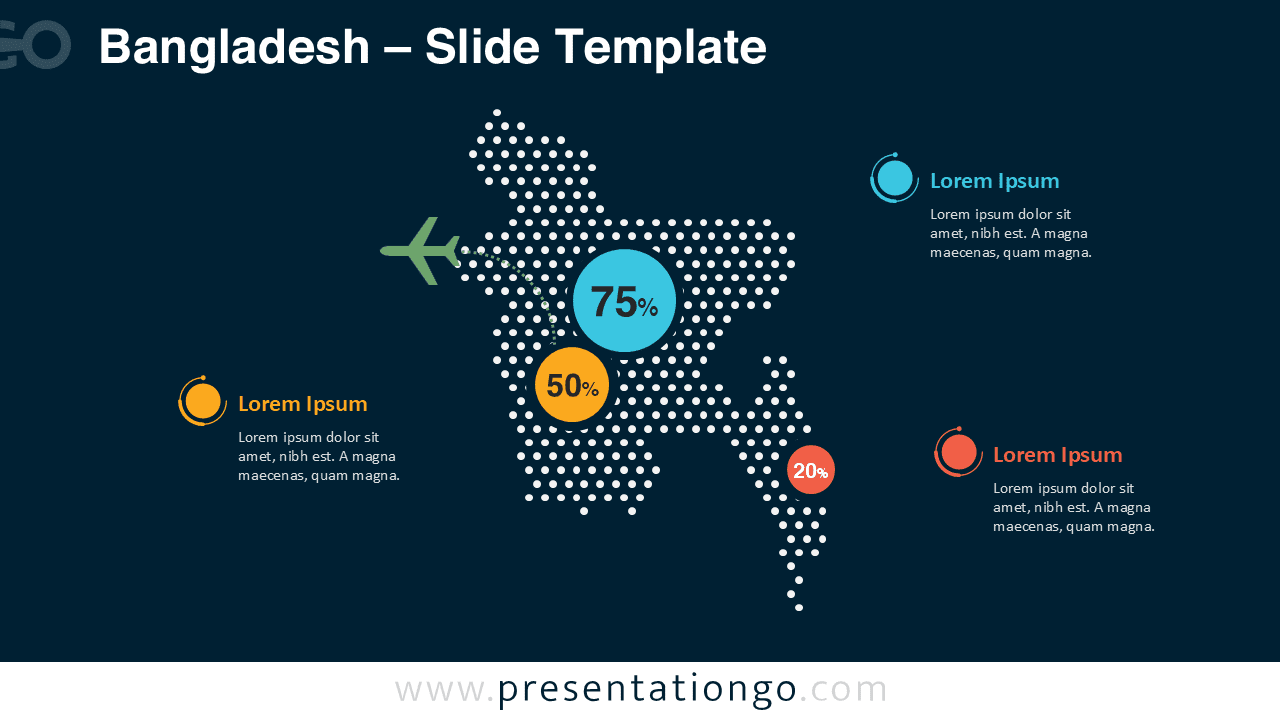
Two slide variations are included: one optimized for light backgrounds and another for dark presentations. This flexibility allows the infographic to match a wide range of presentation styles and corporate color themes.
Practical Applications
- Regional data analysis within Bangladesh
- Business expansion or market research presentations
- Tourism and travel industry reports
- Economic or demographic studies
- Government or policy presentations
- Educational geography lessons
Summary
The Bangladesh Dotted Map Infographic is a versatile and visually engaging tool for presenting geographic insights. Its modern dotted design, editable layout, and compatibility with PowerPoint and Google Slides make it ideal for professionals, educators, and analysts who need to communicate regional information clearly and effectively.