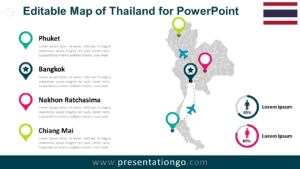
The Thailand Dotted Map Infographic is a modern geographic visualization designed for PowerPoint and Google Slides presentations. It allows presenters to highlight regional insights, tourism statistics, market data, or logistics routes using a clean dotted map representation of Thailand.
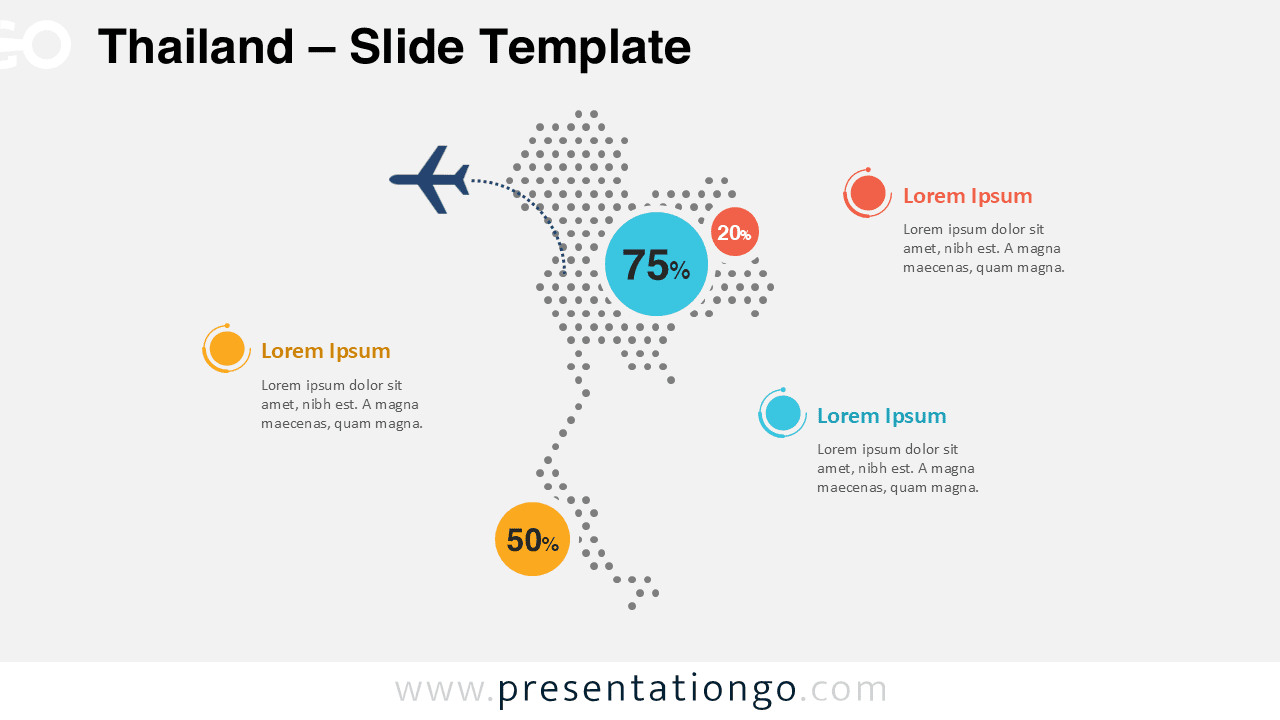
This infographic uses a minimalist dotted pattern to create the recognizable silhouette of Thailand. Combined with circular data callouts and supporting text placeholders, the layout helps transform geographic information into a clear visual narrative.
Map Preview


Features and Customization Options
- Editable dotted map of Thailand
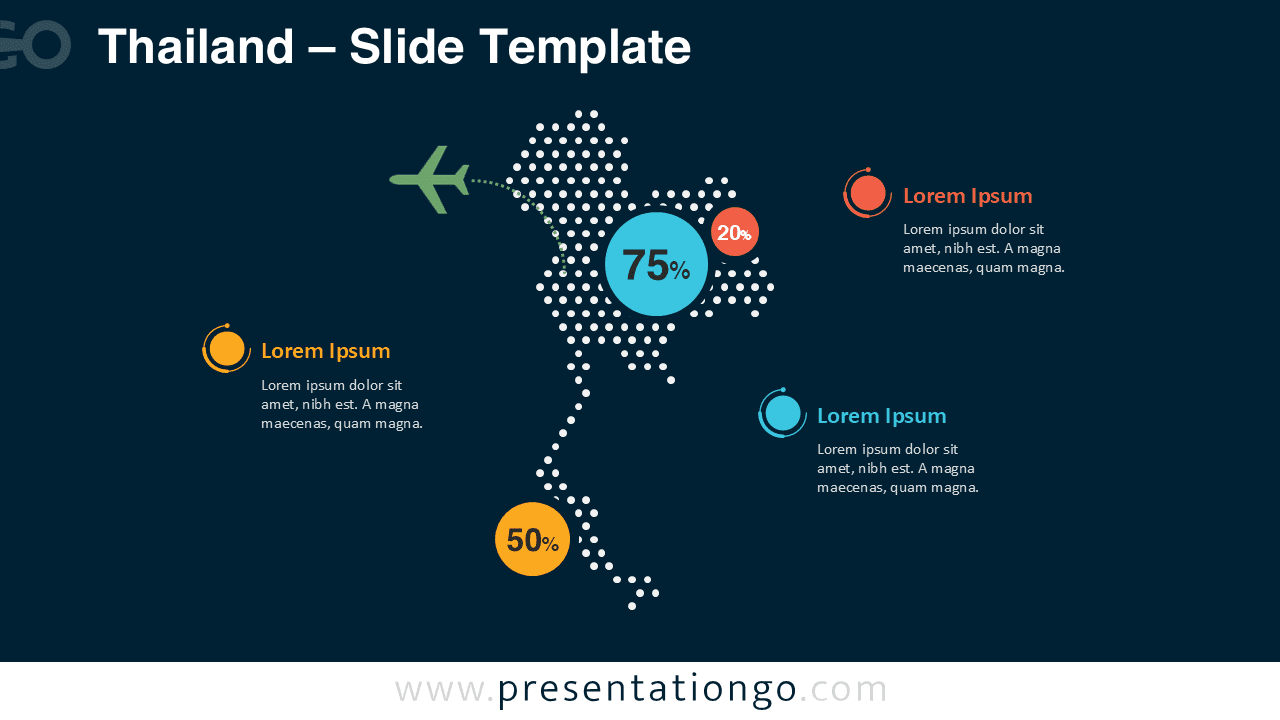
- Two slide versions for light and dark presentation themes
- Customizable percentage indicators and data callouts
- Fully editable colors, shapes, and text
- Compatible with PowerPoint and Google Slides
- Vector shapes that scale without losing quality
Design and Structure
The infographic centers around a dotted map of Thailand built with evenly spaced circular markers. This technique creates a modern data-visualization aesthetic while keeping the geographic shape instantly recognizable.
The layout includes multiple circular data indicators positioned around the map. Each callout connects visually to different regions, allowing presenters to highlight statistics such as tourism numbers, economic growth, logistics hubs, or demographic data.
A curved flight path with an airplane icon adds an additional storytelling element. This feature makes the infographic particularly useful for travel, aviation, and international business presentations related to Thailand.
Practical Applications
- Tourism and travel industry presentations
- Market analysis within Thailand
- Business expansion and investment reports
- Regional demographic statistics
- Transportation or logistics routes
- Education and geography presentations
Summary
The Thailand Dotted Map Infographic offers a visually engaging way to present geographic insights. With editable elements and two theme variations, it integrates easily into professional presentations created in PowerPoint or Google Slides.
Whether you are presenting tourism data, market statistics, or regional development insights, this infographic provides a clear and modern visual structure that enhances audience understanding.