The South Africa Dotted Map Infographic gives you a clean and modern way to present geographic information in PowerPoint and Google Slides. It combines a dotted country silhouette, bold percentage markers, and short text areas to help you highlight locations, trends, and regional insights with clarity.
The layout guides attention quickly without feeling crowded. It keeps the focus on the map while giving you enough space to explain key figures, important regions, or movement across the country.
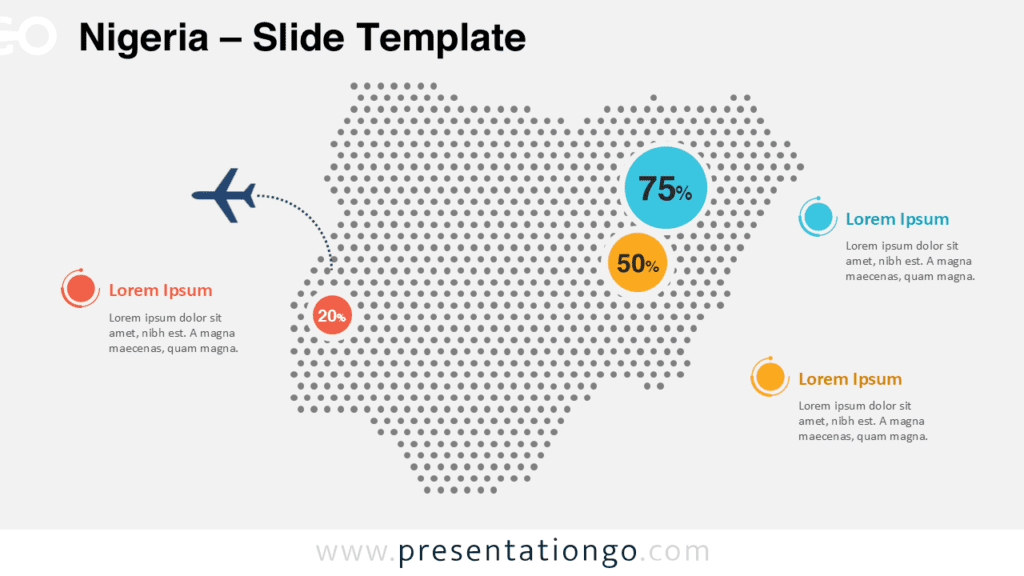
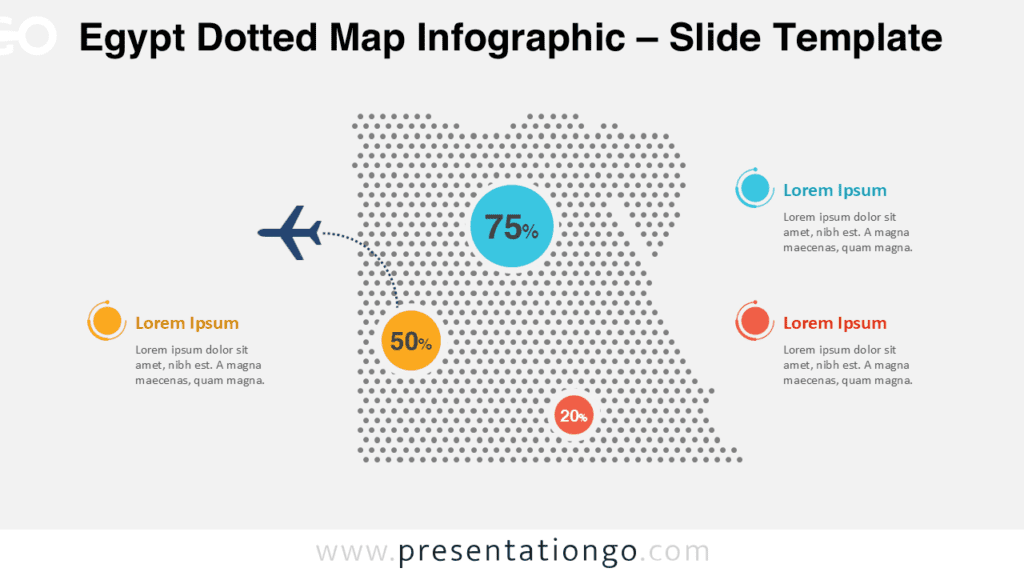
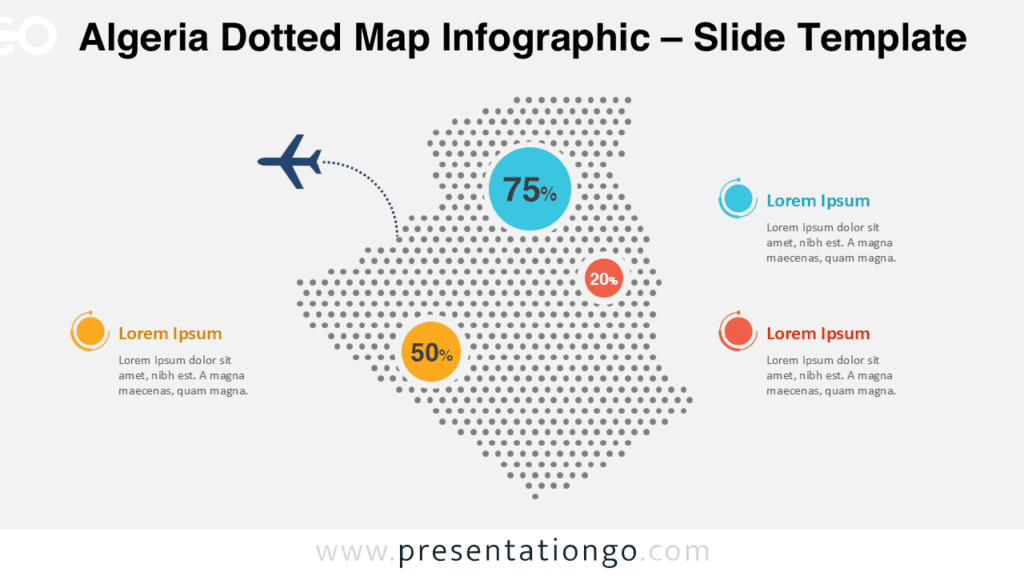
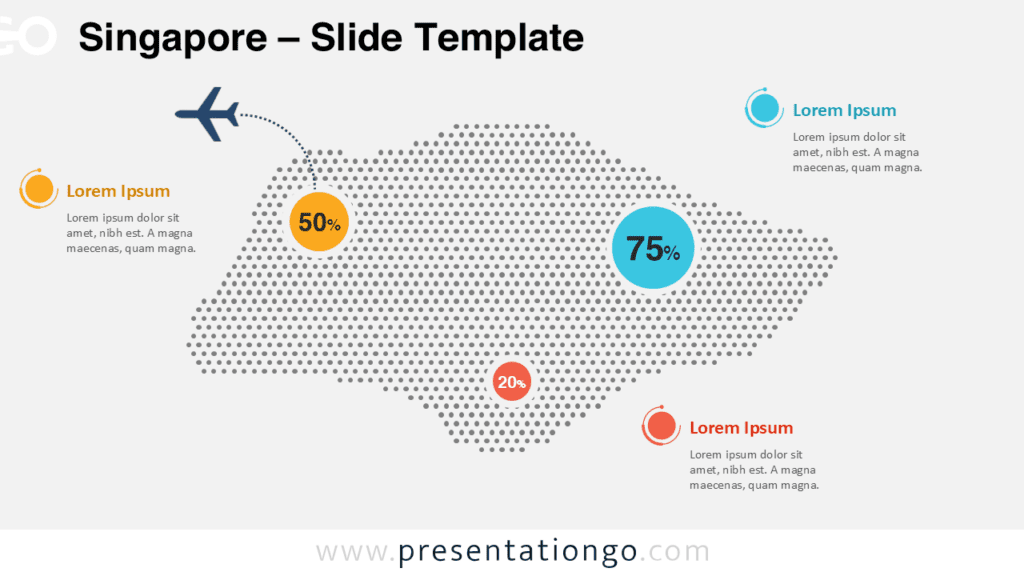
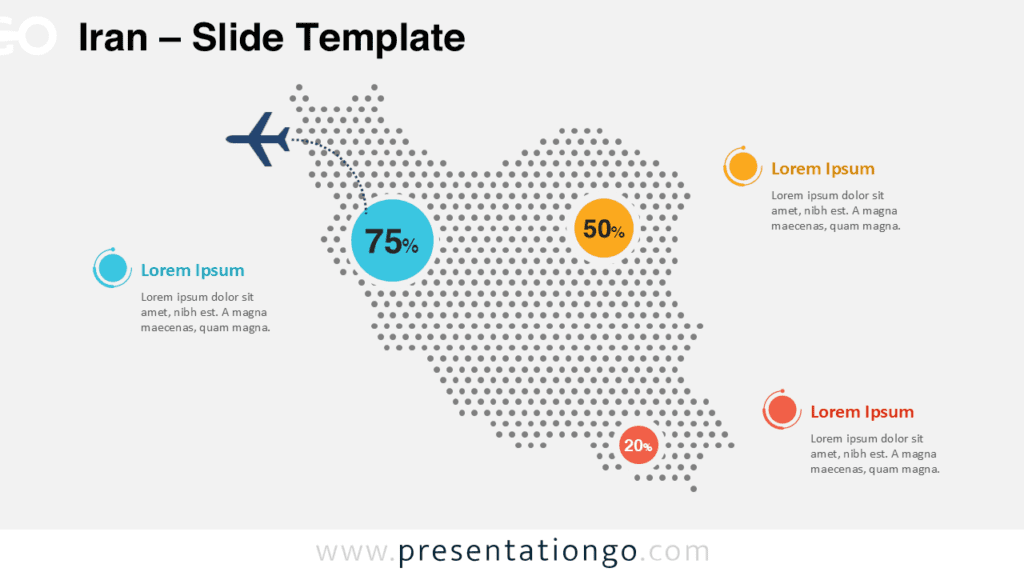
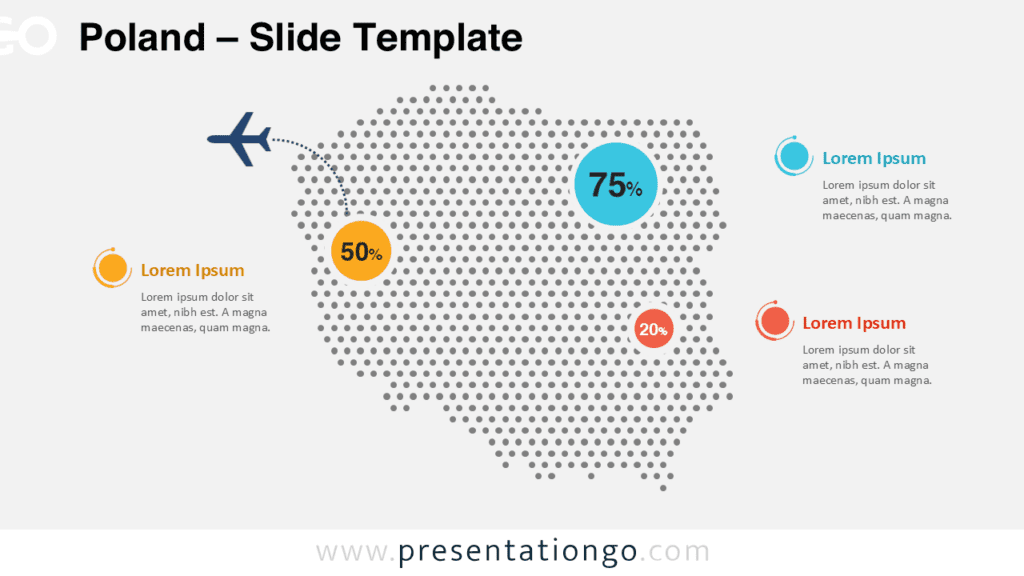
Dotted Map Preview


Features and Customization Options
- Editable dotted South Africa map layout
- Two versions for different presentation styles
- Customizable percentage circles and text blocks
- Easy editing for labels, markers, and content areas
- Compatible with PowerPoint and Google Slides
Design and Geographic Coverage
This infographic focuses on South Africa and presents the country shape through an evenly spaced dot pattern. The structure feels balanced, readable, and professional, which makes it easy to integrate into business decks, academic presentations, and travel-related reports.
Large circular markers create strong focal points across the map and help separate important data points from supporting information. The curved flight path adds a sense of movement, which makes the slide especially useful for tourism, transport, logistics, and route-based storytelling.
Both versions keep the same structure, so you can switch between them without changing your content. That consistency makes the infographic practical when you want a unified look across different presentations or audiences.
Practical Applications
- Show regional statistics or performance indicators
- Present tourism, mobility, or travel information
- Highlight logistics routes and service areas
- Support education and geography lessons
- Visualize market presence across South Africa
- Create location-based business or research reports
Summary
The South Africa Dotted Map Infographic turns location data into a clear visual story. It gives you an editable map, strong emphasis points, and a professional structure that fits many presentation topics.
Use it when you need to explain where something happens, how regions compare, or why a location matters. It is a practical choice for anyone who wants to present South Africa in a polished and engaging way.