The Australia Insights Map helps presenters show regional information with clarity and structure. This editable diagram works in PowerPoint and Google Slides, so you can adapt it for business, education, planning, or analysis. It combines a large Australia map with supporting insight blocks, icon markers, and a key takeaway area. The layout helps your audience understand geographic information quickly.
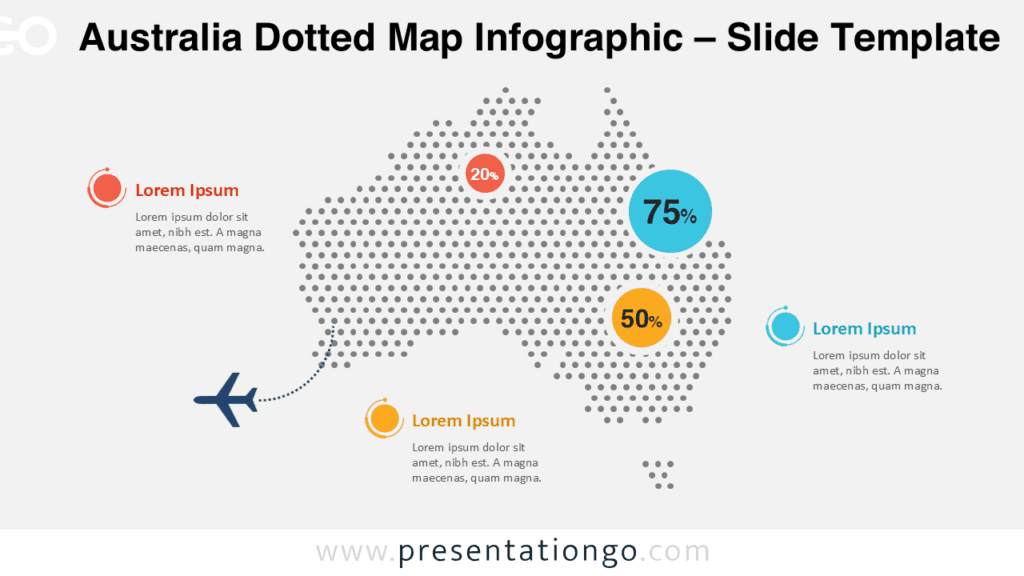
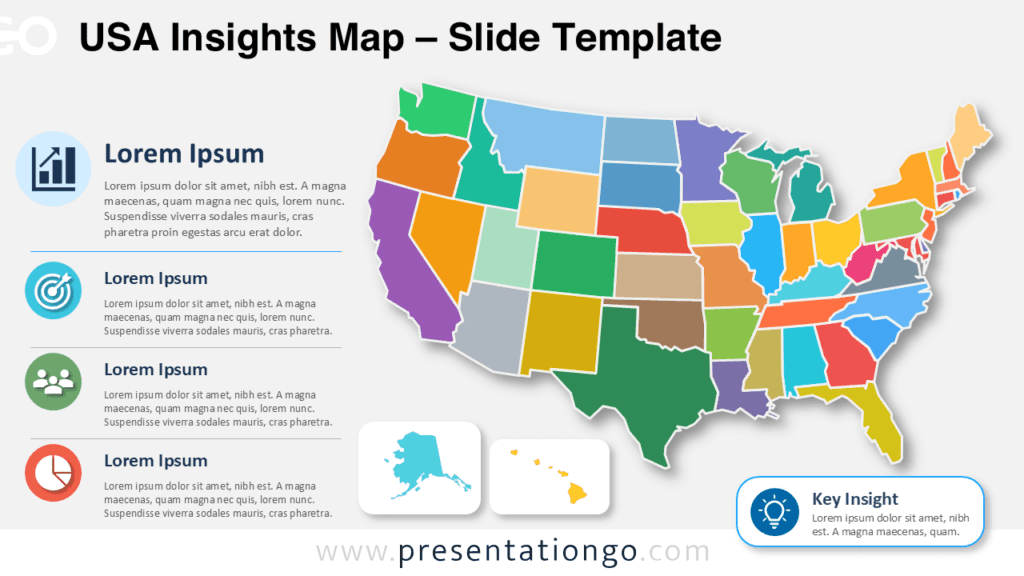
Slide Template Preview


Features and Customization Options
- The Australia map is completely editable, including each region and shape.
- You can change the map colors easily to match your brand or topic.
- The text areas let you add regional data, short findings, or presentation notes.
- The callout section highlights one key insight or main takeaway.
- The icons come from the Office icon library and are easy to modify.
- You can resize, recolor, replace, or remove the icon placeholders.
- The diagram works in both PowerPoint and Google Slides.
- The two slide versions help you use the same design in different deck styles.
Design and Structure
The Australia Insights Map uses a balanced composition that separates geographic content from supporting explanations. The map occupies the main visual area and gives the slide a strong focal point. The left column supports the visual story with four editable insight sections. Each section includes an icon, a heading, and a short description. This structure helps you present several regional points without overloading the slide.
The bottom callout adds a dedicated space for your most important message. You can use it to summarize a trend, highlight a strategic priority, or show a key result. Since every main element is editable, you can quickly adapt the diagram for different industries and topics.
Practical Applications
- Present regional sales performance across Australia.
- Explain market opportunities by territory or state.
- Share demographic, logistics, or education insights.
- Build consulting reports with geographic context.
- Support strategy, expansion, or operations presentations.
- Create classroom slides about Australia and its regions.
Summary
The Australia Insights Map gives you a flexible way to present regional information in a professional slide format. You can edit the map, update the labels, modify the icons, and adapt the callouts to your message. Use it to transform location-based information into a clear visual story for PowerPoint and Google Slides.