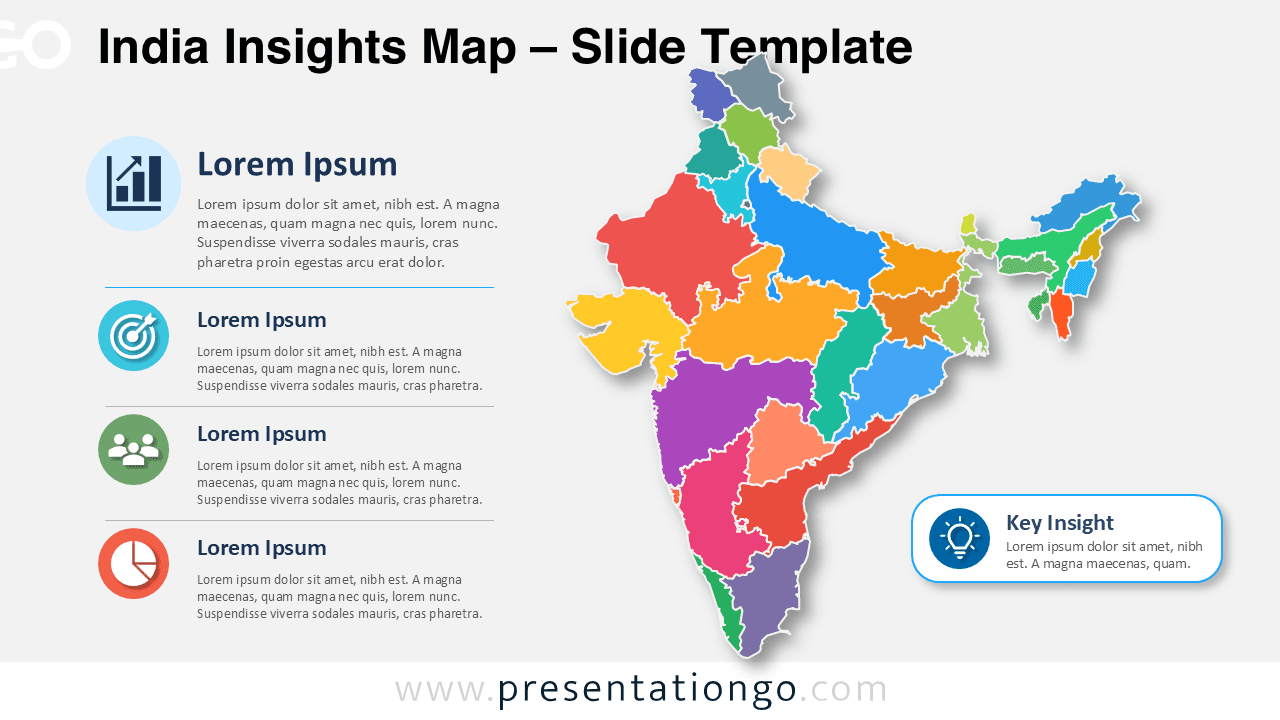
The India Insights Map helps you present regional information with clarity and impact. This editable diagram works in PowerPoint and Google Slides, so you can adapt it to business, education, research, or public policy presentations. Use the India Insights Map to compare territories, summarize findings, show market opportunities, or explain location-based performance in a clean visual format.
Slide Template Preview


Features and Customization Options
- Completely editable India map with separate regional shapes for flexible customization.
- Easy color editing, so you can adapt the map to your brand or presentation theme.
- Editable text placeholders for regional notes, business insights, research summaries, or classroom explanations.
- Icons from the Office icon library, making them easy to modify, recolor, replace, or remove.
- Four structured insight blocks designed to organize key points beside the map.
- Dedicated key insight callout to highlight one important takeaway or strategic recommendation.
- Works with PowerPoint and Google Slides for simple editing across common presentation platforms.
- Designed for quick customization without advanced design skills.
Design and Structure
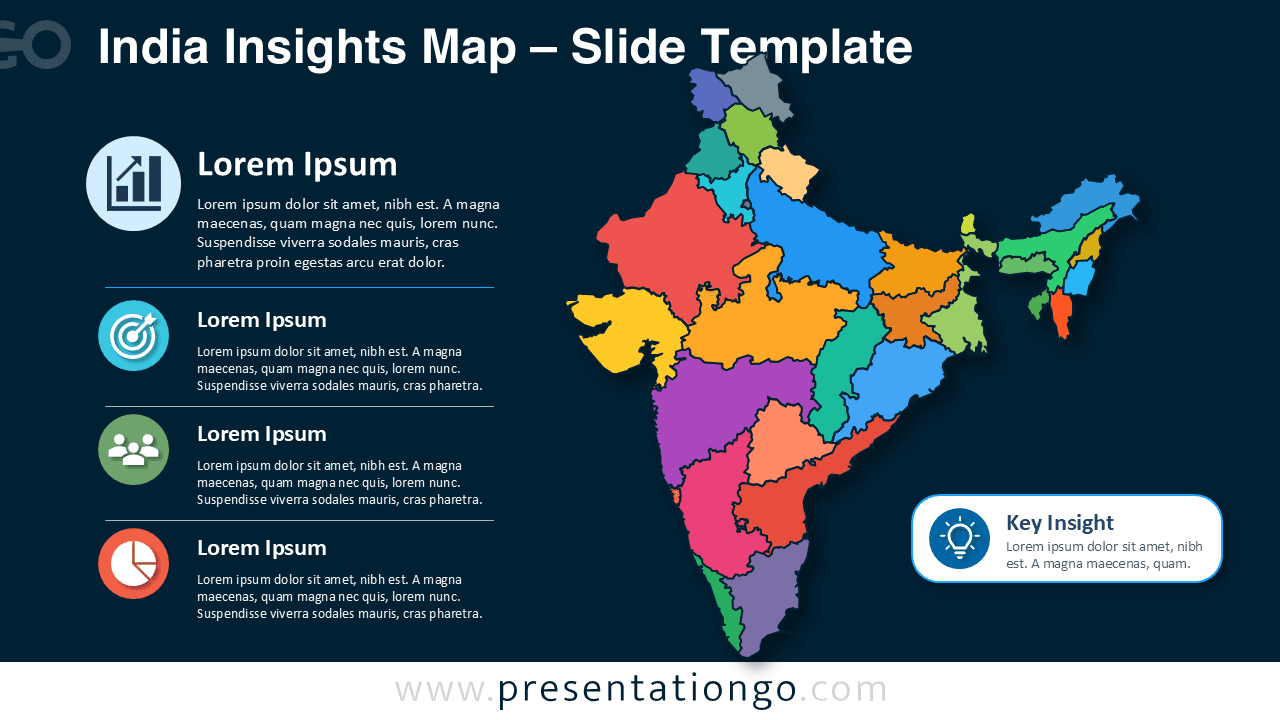
The India Insights Map uses a balanced layout that keeps the map as the main visual focus. The right side displays the geographic area, while the left side gives space for supporting insights. This structure helps presenters connect regional data with clear explanations. The lower callout adds emphasis and helps audiences remember the main conclusion.
Each section of the diagram serves a clear purpose. The map supports location-based storytelling. The insight blocks organize supporting details. The icon placeholders add visual cues. The callout reinforces the most important message. Together, these elements create a professional slide for data-driven communication.
Practical Applications
- Present regional market performance across India.
- Compare sales, operations, or distribution areas.
- Explain demographic, economic, or educational insights.
- Show business expansion plans or territory coverage.
- Summarize research findings by region.
- Create strategy reports for India-focused projects.
- Support classroom lessons about geography, business, or public policy.
Summary
The India Insights Map gives you a practical way to present geographic information in a professional slide format. You can edit the map, update the text, modify the Office icons, and adjust the visual style with ease. Use it to create clear India-focused presentations for business reports, strategy meetings, research summaries, education, and regional analysis.